The concept of metal surface quality after processing
After processing on a milling machine, as after other work with the workpiece, irregularities are formed on its surface - ridges and depressions (in other words, roughness and waviness). Residual stress also appears in the upper layers of the material; at some rolling depths, a difference in hardness appears, which manifests itself as hardening or hardening. Such changes affect the properties of finished products and, consequently, the quality of their surfaces. All these characteristics determine the class of metal processing.
The quality of finished parts is determined by both their physical and geometric characteristics.
- Physical quality criteria.
The surface quality of a product is determined by the relationship between the physical and mechanical properties of its central part and its outer part.
During the processing of metal workpieces, their surface is subject to plastic changes, therefore other characteristics of the material in the finished product differ from the original ones. At the same time, the outer part of the plate is strengthened and internal stresses appear in it.
After the final stage of metal processing on a milling machine, the hardened layer extends only a few hundredths of a millimeter, while after the initial impact of a cylindrical cutter its thickness averages 0.04–0.08 mm, reaching 0.12 mm. When exposed to an end mill, the parameter is 0.06–0.1 mm, although it can be 0.2 mm. The resulting internal stresses and surface hardening lower the class of metal processing by reducing the fatigue strength of the product. Such deformations shorten the service life of the part, which leads to the need for its immediate replacement.
We recommend articles on metalworking
- Steel grades: classification and interpretation
- Aluminum grades and areas of their application
- Defects in metal products: causes and search methods
- Microgeometric quality criteria.
During rough rough processing with a gear cutter at high speeds and with an increased depth of section, irregularities remain on the edge of the product, which are noticeable to the naked eye and are easily determined by touch. Roughness and waviness formed during intermediate and finishing machining at low speeds and during shallow cutting are visually invisible and can barely be felt.
The class of geometric accuracy of metal processing depends on the presence of irregularities on the surface of the product: depressions, ridges, roughness, etc. Such defects on a small surface area are called its microgeometry.
The microgeometry of the surface when processing rolled products depends on:
- cutter geometry, its quality and degree of wear;
- vibrations arising due to insufficient rigidity of the machine or its working elements;
- established settings for the operation of the milling machine (cutting speed and depth, feed per tooth, cooling);
- mechanical properties of the processed sheet and the cutter itself.
Methods for measuring surface roughness of parts.
Means for measuring surface roughness are divided into quantitative and qualitative.
Quantitative ones include: profilometer; profiler; double microscope; interference microscope, these devices determine irregularities in the cross-section; pneumatic device - for assessing micro-roughness of a surface area using the integral method.
Qualitative ones include: samples of surface cleanliness; comparative microscope.
Profilometers are used for shop monitoring of surface roughness of 5-12 frequency classes according to GOST 2789-59.
The determined roughness indicator is the arithmetic mean deviation of surface roughness from the center line. The most widely used contact electrodynamic profilometers are KV-4, KV-7 (V. M. Kiseleva) and PCh-3 (V. S. Chaman).
Profilometers KV-4 and KV-7 have an electrodynamic sensor (Fig. 1), consisting of a moving coil 4 located in the magnetic field of a magnet 3, the coil is rigidly attached to a needle 2 moving along the controlled surface 1.
Figure 2.1 – Diagram of profilometers with an electrodynamic sensor (KV-4, KV-7).
The oscillations of the needle excite an electromotive force (emf) in the winding of the coil 4, which is proportional to the speed of oscillation of the needle. Since the e.m.f. is very small, the device has an amplifier 5. The amplified voltage is integrated over time by a special link. After integration, the voltage at the output of the amplifier, proportional to the instantaneous value of the needle position (the height of the needle on the profile), is measured by device 6, showing the arithmetic mean value of the voltage, and, consequently, the microroughness of the profile.
The profilometer is equipped with two sensors - types B and M and is used to measure the roughness of flat and external cylindrical surfaces, the type M sensor is used to measure the surface roughness of holes with a diameter of d = 5 mm.
The drive is used to mechanically move the sensor at a uniform speed (usually 5-6 mm/s).
The errors of the measurement method, including systematic errors of feeling the surface with a needle, are within ±15% for any of the cleanliness classes. The device's own error does not exceed ±5%.
Profilographs are intended for laboratory research of surface roughness. They provide an enlarged profilogram of the surface microprofile. The height of the irregularities is determined from the profilogram.
The interference microscope of V.P. Linnik is designed for laboratory testing of finely machined surfaces.
Measurement limit - 10-14th frequency classes
Measurement method - Absolute
Inspection productivity - 15-20 parts per shift
Overall dimensions of the microscope - 370x270x280 mm
Weight - 23 kg.
The measurement method is based on the use of the interference phenomenon /13/.
The pneumatic device is intended for monitoring surface roughness of classes 4-9.
The adjustment is made according to domestic technological samples of surface cleanliness or according to exemplary parts.
The measurement method is based on determining the air flow rate, which varies depending on the size of the cavities of micro-roughnesses under the end of the measuring head nozzle (Fig. 2). The device (Fig. 3) consists of a set of pneumatic measuring heads 1 and a float micrometer 2. The set of pneumatic heads includes two heads for measuring the roughness of flat surfaces (one head for grades 4-6, the second for grades 3-9), and two heads for checking cylindrical surfaces with a diameter of 25-90 mm (for grades 4-6 and 6-9). A float micrometer, which determines the total air flow through the depressions of micro-irregularities, gives readings depending on the shape and size of the profile of micro-irregularities.
Figure 2.2 – Diagram of the pneumatic measurement principle.
Figure 2.3 – Diagram of a pneumatic device.
The surface roughness is determined by the position of the float in a conical glass tube with a taper of 1:1000. The micrometer scale is calibrated using technological samples, the surface roughness of which is determined by instruments for absolute measurements (profilometers, double microscopes).
Samples of surface cleanliness.
Determining the surface roughness of parts by comparison with samples is widely used in workshops, as well as when assigning classes of surface cleanliness of newly designed parts. Such samples are also used for setting up instruments whose operation is based on the use of comparative methods for assessing surface roughness (pneumatic instruments).
Visual inspection of the surface roughness of parts by comparison with samples gives reliable results for surfaces up to class 6 inclusive. When inspecting surfaces of classes 7–10, the possibility of assigning the surface of a part to a neighboring cleanliness class is not excluded.
A graph of the control error by comparison with samples is shown in Fig. 2.4.
The comparison microscope improves the accuracy of their determination of the surface roughness of parts by comparison with samples.
The optical system of the LITMO microscope (Fig. 2.5) allows you to simultaneously observe an enlarged image of the surfaces of the sample and the part being tested.
The rays from the light source 1 enter through the condenser 2 onto the separating prism 3. Some of the rays, having passed this prism, enter through the lens 4 onto the surface of the sample 5 and, having been reflected, return to the prism. Having been reflected from the plane of the prism junction, the rays produce an image in eyepiece 7, occupying half the field of view.
Figure 2.4 – Graph of control error by comparison with samples.
Figure 2.5 – Diagram of a comparative microscope.
The second part of the rays, reflected from the interface plane of the prism, goes through the lens 4 to the controlled surface of the part 6. After reflection, the rays pass through the prism and give an image of this surface to the second half of the field of view of the eyepiece 7. By comparing the images of both surfaces, the efficiency is determined. surface cleanliness of the part
The operating principle of the MIS-11 microscope and the determination of surface roughness of samples.
Double microscope MIS-11 V.P. Linnika is intended for laboratory testing of surface roughness of grades 3-12. The determined surface roughness indicator is . The measurement method is based on the principle of light section.
On the inspected surface of the part 1 (Figure 6), a light slit 2 is projected at an angle (usually 45°) through the lighting tube, viewed at an angle through the observation tube 3. Since there are microroughnesses on the inspected surface, the line of intersection of the light projection of the slit and the surface is a curve , which controls irregularities in a given section.
A distorted surface contour is observed in the eyepiece. The heights of micro-irregularities are measured using an eyepiece micrometer and determined by the formula:
Rz=A*E (1.1)
A – difference in readings along the micrometer eyepiece drum; -h;
E – the division price of the eyepiece-micrometer drum.
Figure 2.6 – Diagram of a double microscope.
The Rz value is determined from several readings. Due to the high error and heterogeneity of the controlled surface, it is necessary to make several measurements in different areas. It is recommended to take:
Surface grades: 3-4th; 5-6th; 8-9th.
Number of sections: 1; 2-3; 3-5.
The estimation error decreases sharply if you photograph micro-irregularities and determine Rz from the photograph.
Figure 2.1– Characteristics of the optical system of the MIS-11 double microscope
The results of measuring the surface roughness readings must be entered in the table. 1.
Complete laboratory work, fill out Table 1.
Determination of the roughness class by the value of Rz is carried out taking into account table. 2.
Perform laboratory work, fill out Table 2. Roughness parameter and classes.
Reporting type
- purpose, objectives and summary of the work.
— describe the operating principle of the MIS-11 microscope.
— present the results of surface roughness measurements according to Table 1 and determine the roughness class according to Table 2.
— brief conclusions based on the research results.
— perform laboratory work, fill out the Report Form. Tab.1.
Categories of metal processing purity
The cleanliness class of metal processing depends on the degree of roughness of its surface. It is calculated as the height of the irregularities and the frequency of their repetitions. This indicator is influenced by two main factors: the method of influence and the tool used.
There are four categories of metal workpiece processing cleanliness:
- Rough when roughness is visible to the naked eye. It is obtained as a result of manual processing using a large file or using cutters, knives, drills at the initial stage of machine processing.
- Semi-clean when irregularities are barely noticeable or unnoticeable upon visual inspection. Achieved by using a hand-held fine-abrasive file or a specialized machine for finishing.
- Clean when surface defects are visible only when additional tools are used. It is obtained by finishing with a velvet file or using a special grinding unit.
- Very clean when surface irregularities are almost completely absent. Achieved through the use of lapping or high-precision manual grinding with files with a minimum degree of abrasiveness. This class of metal processing purity is considered the reference.
What is surface roughness?
To answer this question, let's think about how parts are made. In any case, in order to give the source material the appearance of the part shown in the drawing, it has to be sawed off, cut, drilled, milled or bent. Bending and other deformations do not particularly concern us now, but the mechanical processing described above does.
When cutting a material, the surface along which the cutting tool passes remains by no means smooth; there will be nicks, scratches and other differences on it. This is surface roughness. They are, of course, not so huge as to be immediately noticeable - their size is in the region of several micrometers. And these dimensions, not surprisingly, are clearly indicated in the corresponding GOST. This is GOST 2789-73 - “Surface Roughness”.
This standard contains a graphic representation of the irregularities in question.
Figure from Wikipedia, the free encyclopedia
When you magnify any surface of the material, you can see a similar picture. Based on the relationships between the roughness parameters indicated in the drawing, several basic types of roughness can be deduced, which we indicate in the drawing.
- Ra is the arithmetic mean deviation of the profile;
- Rz—height of profile irregularities at ten points;
- Pmax—maximum profile height;
- Sm is the average pitch of irregularities;
- S is the average pitch of local profile protrusions;
- tp is the relative reference length of the profile, where p is the level value of the profile section.
When indicating roughness in a drawing, the preferred option is Ra, which is what GOST tells us.
Let's consider the first two options for roughness Ra and Rz.
In the case of Ra, its numerical expression is the arithmetic mean of the absolute values of profile deviations within the base length, and it is formed according to the formula:
where l is the base length, n is the number of selected profile points on the base length.
In the case of Rz, the sum of the average absolute values of the heights of the five largest protrusions of the profile and the depths of the five largest depressions of the profile within the base length is taken:
where ypmi is the height of the i-th largest protrusion of the profile, yumi is the depth of the i-th largest depression of the profile.
In GOST there is a plate that summarizes all possible values of roughness Ra, and the preferred ones are emphasized.
Methods and tools for assessing roughness
Evaluation parameters and surface roughness measurement
5 Methods and tools for assessing roughness
surfaces
Surface roughness is assessed by two main methods: qualitative and quantitative.
The qualitative assessment method is based on comparing the treated surface with a standard (sample) surface through visual comparison, comparison of sensations when palpated with the hand (finger, palm, nail) and comparison of observation results under a microscope.
Visually, you can quite accurately determine the class of surface cleanliness, with the exception of very finely processed surfaces.
Standards used for visual assessment of surface roughness must be made of the same materials, with the same surface shape and the same method as the part.
Qualitative assessment of very finely machined surfaces should be made using a microscope; You can use a magnifying glass with 5x or higher magnification.
The quantitative assessment method consists of measuring surface microroughness using instruments: profilograph K. M. Ammon, profilograph B. M. Levin (models IZP-17 and IZP-5), double microscope and microinterferometer V. P. Lnnnik, profilometer V. M. Kiseleva et al.
Scheme of the B-M profiler. Levin (model IZP-17) is shown in Figure 3.
A beam of light from lamp 1 falls on mirrors 8 and 7, passing through lens 2, slit 3 and optical system 5.
Mirror 8 is connected to a probing needle. A ray of light reflected from the mirror 7 and then
from the mirror 8, passes through the optical system 6, falling on the mirror 4 and then on the cylindrical lens 14, projects the image of the slit 3 onto the photosensitive film 13 located on the drum 12. The image of the slit is projected in the form of a light point.
The part 10, the surface of which is being measured, is located on the upper disk of the table 11, which is given translational motion relative to the needle 9 with simultaneous rotation of the drum 12.
The speed of taking a profilogram can be changed by changing the rotation speed of the drum. The speed of movement of the table 11 does not depend on the speed of rotation of the drum 12, which provides three horizontal scales with magnifications of 25 and 50.
Vertical magnification sizes in the range of 250 - 5000 are achieved by changing the lens 6 and installing the needle 9 in various holes of the lever.
The maximum height of micro-irregularities recorded on drum 12 depends on the vertical magnification; The length of the profiled section (1.75 - 7 mm) of the surface under study depends on the horizontal magnification.
To measure micro-irregularities ranging from 4th to 14th classes of surface cleanliness, a profilometer designed by V. M. Kiselev is used, the operating principle of which is to excite an electromotive force as a result of the oscillatory movements of a probing needle.
Figure 4 shows a diagram of this profilometer (model KV-7). A needle 1 with a diamond tip, the radius of curvature of which is 12 microns, is suspended on springs 2. Its lower end feels the unevenness of the surface of the part, and the upper end is connected to an induction coil 3, which moves in the magnetic field of poles 4 and 6 of magnet 5. The small currents excited by this movement amplified and marked by a galvanometer.
The sensor moves along the surface being tested at a speed of 10-20 mm/sec. The needle pressure on the surface of the part being tested is in the range of 0.5-2.5 gf/mm2.
By connecting an oscilloscope to the profilometer, you can obtain a profilogram of the surface under study.
To measure surface roughness from 3rd to 9th cleanliness classes, a double microscope by V.P. Linnik is used (Figure 5).
The device consists of two parts: microscope A for illuminating the surface under study, microscope B for observing and measuring the profile of the surface. The axes of both parts of the microscope are inclined at an angle of 45° to the surface under study with the points of intersection of the axes coinciding with the object points of the lenses.
In the image plane of the lens 3 of the microscope A, a slit 2 is located perpendicular to the plane of the microscope axis with illumination from a light source 1. The lens 3, when reduced, gives an image a1 of the slit 2 on the plane being checked P in the form of a narrow luminous line. If there are no microroughnesses on the surface area P, the lens 4 of the microscope B in the plane of the eyepiece grid 5 will give an image a2 of the same narrow luminous line, as well as an image of the nearby area of the surface under study.
With the same arrangement of microscopes A and B, in the presence of micro-irregularities h, part of the light beam reflected from a section of surface P1, when observed, will appear to emerge from point a1 or from point a'1 of surface P'1, located at a distance 2h below surface P. Then the image of point a'2 on the eyepiece grid 5 will be at a distance h' from the axis of microscope B, equal to
h'=2*x*h*sm45°, (5)
where x is the magnification of lens 4.
To measure the height of irregularities, an eyepiece micrometer is installed in microscope B.
The double microscope of V.P. Linnik also makes it possible to photograph the surface under study from a height of irregularities from 0.9 to 60 microns.
To measure micro-irregularities from 0.1 to 6 μm with a magnification of 400 to 500, V. P. Linnik microinterferometers with interference fringes corresponding to the profile of the surface under study in a given section are used (Fig. 6). Using the eyepiece, the value a is measured, expressing the height of the micro-irregularities, and the value b is measured, corresponding to the distance between two adjacent interference fringes, then the height of the micro-irregularities
h=0.25*(a/b), µm. (6)
To determine the surface roughness in hard-to-reach places, the method of taking impressions from the surface under study is used, the surface roughness of which subsequently serves as an assessment criterion using the above instruments. The distortion of the profile of the surface under study when taking an impression practically does not exceed 2 - 3%.
Celluloid dissolved in acetone is usually used as materials for impressions. To obtain an impression, celluloid is dipped in acetone for a short time (2 - 3 minutes), then applied to the surface under study and dried for 10 - 50 minutes (depending on the roughness of the treated surface).
When technologically feasible, the shear method is also used to assess the microgeometry of the surface.
The surface under study is coated with a layer of chromium 5-10 microns thick, and then a cut is made at an angle of 1-2°; the cut plane is etched and then photographed.
A photograph is a profilogram in which the horizontal magnification is the magnification obtained by photographing, and the vertical magnification is the horizontal magnification multiplied by the magnification obtained from the oblique cut.
The magnification from an oblique cut at a cutting angle of 1° is 60 times, and at a cutting angle of 2° it is 30 times. Using an oblique cut, you can obtain a profilogram with a vertical magnification of up to 8000.
6 Dependence of surface roughness and
accuracy from species
processing
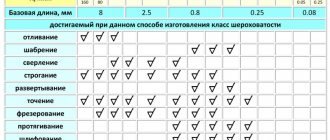
Practice and research have determined the relationship between types of processing and surface roughness (cleanliness classes). For example, it has been established that the average height of irregularities should not exceed 10 - 25% of the processing tolerance. This made it possible to establish the achievable surface cleanliness for various types of processing, and taking into account the costs required to achieve a given cleanliness, which do not exceed the costs of any other processing method, and the economically achievable surface cleanliness.
7 List of used literature.
1. Fundamentals of mechanical engineering technology: Textbook for universities / V.M. Kovan,
V.S. Korsakov and others; Ed. Korsakov. -ed. 3rd, add. And reworked. -M.:
"Mechanical Engineering", 1977; 336 pp. ill.
2. Mechanical engineering technology: In 2 vols. T. 1. Fundamentals of technology
mechanical engineering: Textbook for universities / V.M. Burtsev, A.S. Vasiliev,
A.M. Dalsky et al.; Edited by A.M. Dalsky. — 2nd ed., stereotype.
-M.: Publishing house of MSTU im. N.E. Bauman, 2001; 564 p., ill.
Evaluation parameters and surface roughness measurement
Information about the work “Quality of the processed surface”
Section: Technology Number of characters with spaces: 17469 Number of tables: 0 Number of images: 0
Similar works
Surface roughness and its image in the drawings
31391
10
12
... surface roughness established by GOST 2789-73. The designation of surface roughness and the rules for their application in the drawing are established by GOST 2309-73. The structure of the roughness symbol is shown in Fig. 6 Fig. 6 The structure of the symbol for depicting surface roughness When establishing surface roughness requirements, it is recommended to use the parameters Ra, Rz, Rmax, tp. ...
Surface roughness
21636
2
3
... surfaces of engine cylinders, etc.). Proper surface quality also plays an important role in joints that meet the conditions of density, tightness, and thermal conductivity. As surface roughness decreases, their ability to reflect electromagnetic, ultrasonic and light waves improves; the losses of electromagnetic energy in waveguide paths, resonating systems are reduced, ...
Methods and importance of non-destructive product quality control
45603
0
1
..., introduction of advanced equipment, increasing the efficiency of metal quality control methods, active implementation of an integrated product quality management system, constant improvement of labor, production and performance discipline. Non-destructive quality control by flaw detection methods Flaw detection is a set of methods and means for non-destructive testing of materials and products with ...
Increasing the reliability and durability of shaft seals for VAZ vehicles
106261
13
35
the indenter) is given oscillatory movements in the feed direction. Tests carried out on the SMC-2 machine confirmed the increased reliability of the lip seals operating in tandem with shaft journals processed by this method (research results are given in the next chapter). To increase the efficiency of the hydrodynamic effect that occurs during operation, a new device was developed...
What types of surfaces exist
To ensure interchangeability and unification of production, roughness parameters are combined into classes. There are 14 varieties of them in total. Each class is assigned a specific Ra and Rz value. The most accurate class is the fourteenth, the roughest is the first. For this reason, surfaces have also been classified. The following types are found in production:
- Mounting surfaces that are motionless relative to each other and are not subject to tightness requirements. For them, the Ra value is 2.5-20 µm.
- Working surfaces that move relative to each other. This includes piston-cylinder connections, which can often be found in a variety of engines and pumps. Ra for them is 0.16-2.5 microns.
- Bounding and connecting surfaces. This refers to the elements necessary for fastening and assembly. These are all kinds of cases, clamps and other mechanisms. Ra for them ranges from 2.5-20 microns.
- Special surfaces. Here we mainly refer to the controls. The processing of such surfaces is extremely high with their Ra value of 0.63-0.08 µm.
What types of profilometers are there?
Cleanliness of product processing is of utmost importance in production. It determines, for example, how quickly rotating machine parts wear out to the point of inoperability. Knowing the degree of roughness of a part, you can send it for refinement (grinding) and thereby increase its working life.
Having determined the degree of unevenness of the coating of the body of your car before painting, you can decide whether it is worth continuing to clean it or you can safely apply a coating that will reliably protect your car from rust and will not “peel off” in a week.
The lenses of optical systems and cameras would not allow you to enjoy the excellent quality of nature photographs and portraits if they were not subjected to control using special measuring instruments that can determine the degree of roughness of the sample and even show the result in 2D or 3D format on a PC monitor.
On a note! Devices designed to determine the degree of roughness of various surfaces are called profilometers.
Let's take a closer look at these useful devices.
Contact profilometers
Measuring tools of this type determine the level of cleanliness of the workpiece by coming into close contact with it. The device consists of a carbide or diamond stylus, with a drive connected to a signal generator and an amplifier. To visualize the results, the product is equipped with a display, sometimes touchscreen, and a control panel with power and cursor buttons.
By installing the device on the plane under study and turning it on, we force the probe to move perpendicular to the sample under study. The probe, hitting each irregularity, makes oscillatory movements, i.e. gives the primary signal. When it reaches a transducer, inductive, capacitive or piezoelectric, this mechanical signal becomes electrical (current).
The converted signal is sent to an amplifier and further visualized. As a result of a chain of transformations, we get a picture on the display or a graph on punched tape (if we use a profilograph). The peaks and valleys in the graph indicate the roughness level of the sample.
Differences between devices according to the length of the integration path
This characteristic of contact devices is constantly compared with the palpation path. To make it clear: the length of the integration path is the path that the probe makes along all the peaks and valleys of the test sample, and the palpation path is the length of the path of the probe without taking into account irregularities (in a straight line).
The integration path for some models may be equal to the sensing path. In this case, the final picture can only be seen after the probe has finished moving. Such devices are called profilometers with a constant integration path.
In contrast, devices with a sliding integration path, which in this case is much shorter than the palpation path, produce results simultaneously with the movement of the needle.
Instrument measurement error
One of the most important selection criteria is measurement error. The accuracy class of the product depends on it. It is generally accepted that the lower the accuracy class, the more accurate the device. The most accurate ones have an accuracy class equal to one.
On a note! The most accurate are the so-called reference measuring instruments. They are used to check the accuracy of readings from working devices.
Working meters have the so-called. permissible error expressed as a percentage. For contact devices this value ranges from ±10 to ±25%. When determining which device is better to buy, it is better to opt for the product that has a smaller permissible error.
Profilograph
The same profilometer, only the results of its research are not displayed, but are drawn on a special paper tape. Devices of this type were in use when there were no computers with the ability to visualize processes in the form of graphs and save them in PC memory or on removable media: disks, floppy disks and flash cards.
Today they look somewhat archaic, but somewhere there is still a need for such documentation of the results of scanning samples. Consequently, profilers have a right to exist, they continue to be produced, and they find their buyer. In addition, they are quite simply designed and are cheaper than more modern models.
Optical profilers
Modern non-contact means for determining the degree of roughness of parts. They are distinguished by unique accuracy of results, speed of operations and enormous productivity compared to contact devices.
General operating principle
Such devices use the wave properties of light. The equipment contains a dividing prism that separates the light into rays. One of them falls on the surface under study, the other is sent to an element called the reference mirror. It is important to understand that we have one light source, although it is divided into two beams by a prism. Therefore, the wavelength of both beams is the same.
The distance between the first beam and the sample under study is called the path and can be designated L1. Let us denote the distance between the second beam and the reference mirror as L2, respectively. Comparing these two quantities, we obtain a certain third quantity ΔL, which is called the optical path difference.
If the path difference is zero or an even number of wavelengths, they are in phase (they are in phase), i.e. the peak of one wave coincides with the peak of another, and the troughs coincide with the troughs. In this case, the waves reinforce each other, i.e. the peaks add up and become larger, the troughs add up and become smaller.
Important! This phenomenon is called light interference. The operating principle of optical profilometers is based on this phenomenon.
This way we get an interference pattern - alternating light stripes and dark spaces between them. Based on the glow intensity of the light areas of the interference pattern, one can determine the length of the path traveled by the beam from the dividing prism to the unevenness of the sample under study. In this way, the roughness on the surface of the test sample is calculated.
Confocal profilers
These devices are precisely designed to determine the roughness of parts. The resolution level here is the highest. The relief measurement range is between tenths of a nanometer and tens of millimeters. To study samples with a plane slope within 70°, the devices are equipped with special lenses with a high magnification factor. The modern confocal microscope is characterized by combining its own capabilities with the advantages of interferometry and focal length determination.
Interferometers
The capabilities of phase-shifting interferometers (PSI) are used to study the roughness of fairly smooth samples, without significant differences in height, with a resolution within one nanometer. The devices use light from a monochromatic source.
Important! White light is made up of a set of colors: red, orange, yellow, green, blue, indigo and violet. Monochromatic is a source that emits radiation of one of the listed colors, i.e. a beam of light with a specific wavelength.
White light interferometers
The second name is VCI interferometers. They are characterized by lower resolution and measurement error. In this technique, the sample under study is moved vertically, and the interference patterns are recorded in white light.
With the advent of optical profilometers, it became possible to obtain relief images of the studied samples in 3D format, transfer data to a PC, save them on various media, transfer them over a network, etc. In addition, optical instruments are characterized by very high scanning speed and a significant reduction in the cost of research.
Mechanism of roughness occurrence
All causes of roughness can be divided into 3 groups:
- The location of the cutting edges of the tool relative to the surface being processed;
- Elastic and plastic deformation of the processed metal;
- Vibrations in the technological machine system.
The formation of irregularities on the machined surface can be represented as a trace from the movement of the cutting edges of the tool. Let's call this profile regular.
The formation of a regular profile is influenced by the geometry of the cutter, in particular, the angles in the plan, as well as the feed value S. Their influence is described by the formula
In the actual cutting process, a zone of plastic deformation is formed in front of the cutter and under the machined surface, which introduces some error into the regular profile. Plastically deformed metal in some places seems to be enveloping micro-irregularities, and in some places individual pieces of metal are torn out. Therefore, the real value of Rz can be written as:
where is the increment in the height of microroughnesses caused by plastic deformation of the metal. Consequently, the lower the plastic deformation, the lower the height of the microroughnesses. The amount of plastic deformation depends, to a greater extent, on the hardness of the material being processed and, to a lesser extent, on the cutting depth - t.
Principles for choosing the standard size of equipment for measuring roughness
For a more accurate assessment, and separately for the Rz and Ra indicators, stationary contact devices are used. It is advisable to determine the roughness of surfaces made of hard materials (for example, high-carbon steels) using profilometers equipped with a diamond stylus. It is convenient to record the results either programmatically on a computer or by printing them on paper. By analyzing the measurement results, you can make the necessary adjustments to the technological process of manufacturing parts.
For rapid assessment of the quality of processing directly on site (for large parts), portable profilometers are more useful. The data they receive is the basis for making changes to the settings of machine tools and their CNC systems.
It should be noted that profilometers of all types must be periodically subjected to verification, the content and frequency of which is established by MI 1850-88.
Surface roughness and its influence on the operation of machine parts
During the process of forming parts, roughness appears on their surface - a series of alternating protrusions and depressions of relatively small sizes.
Roughness can be a mark from a cutter or other cutting tool, a copy of the irregularities of molds or dies, and can appear as a result of vibrations that occur during cutting, as well as as a result of other factors.
The influence of roughness on the operation of machine parts is diverse:
- surface roughness can disrupt the nature of the mating of parts due to crushing or intense wear of the profile protrusions;
- in butt joints, due to significant roughness, the rigidity of the joints decreases;
- the roughness of the surface of the shafts destroys various types of seals in contact with them;
- irregularities, being stress concentrators, reduce the fatigue strength of parts;
- roughness affects the tightness of connections and the quality of galvanic and paint coatings;
- roughness affects the accuracy of measuring parts;
- metal corrosion occurs and spreads faster on roughly processed surfaces, etc.
The best manufacturers
Filmmetrics Inc.
American company. Founded in 1995. The main goal is to develop devices that can simplify and speed up the process of determining the thickness of coatings and thin films, as well as reduce the cost of equipment as much as possible.
On a note! In 1995, the cost of such devices reached $50,000. One session lasted an entire hour and required very high qualifications from the operator.
As a result of the development of truly revolutionary problem solving methods, today Filmetrics equipment gets the job done within seconds. Operator training takes a few minutes.
Elcometer
British company. On the market since 1947. The main activity is the development and production of devices for studying the quality of coatings made of various materials without damaging them. Today the company occupies a leading position in the production of modern equipment for assessing the cleanliness of product processing. Many brand samples are positioned by experts as a standard of quality.
Time Group Inc.
Chinese manufacturer of instrumentation and equipment for metal welding. Its surface roughness control products are in high demand on the global market among specialists. Product quality is controlled in accordance with the international standard ISO 9001. Today the company has more than twenty branches in China and about 70 distributors in America and Europe.
Mitutoyo
Japanese brand. Founded in 1934. Since then and until now, it has been producing low-cost and easy-to-use measuring instruments. It all started with the production of micrometers. Today Mitutoyo produces a wide range of measuring instruments, from tape measures and calipers to modern profilometers, stereo microscopes, etc. Popular models of the brand are in high demand among customers.
PCE Group Co KG
The German company is a manufacturer of industrial measuring instruments and equipment that is recognized as perfect in all countries of the world. The popularity of the models is explained by the strictest quality control at all stages of production. The company has production facilities in Germany, Poland and the Netherlands.
Taylor Hobson
The oldest British company, founded in 1886 in the town of Leicester, Leicestershire. She was engaged in the production of cameras and lenses. Currently produces metrological devices. Taylor Hobson models with high precision determine the level of roughness of products and record the slightest deviations, including on super-smooth elements.
The list of manufacturers can be continued for a long time. It is up to the buyer to decide which company is better to buy a profilometer. It is advisable for an inexperienced buyer to listen to the advice and recommendations of experienced operators and study the descriptions and characteristics of the devices. This will help you make the right choice.
The influence of roughness on the performance of parts
As mentioned earlier, in the process of giving a metal sheet the desired configuration, roughness remains at the impact sites - small depressions and ridges that affect the determination of the metal processing class. They can arise due to the unevenness of the cutting tool or vibrations that occur during work, remain as an imprint of unevenness on the stamp or mold itself, etc.
The presence of roughness in a part installed in a machine or other unit can lead to:
- incorrect mating of elements due to crushing of the material or accelerated wear of the protrusions of the part;
- decrease in joint strength, defects when applying paint and varnish and galvanic coatings;
- incorrect results of geometric measurements of an element;
- reducing the rigidity of butt joints;
- destruction of seals mated to shaft surfaces;
- reducing the fatigue strength of the element due to stress concentration in roughness;
- accelerated oxidation and deterioration of metal, etc.
Basic designations
The roughness of the surface under study is measured over tolerably small areas, and therefore the baselines are selected taking into account the parameter of reducing the influence of the wave-like state of the surface on changes in height parameters.
Irregularities on most surfaces arise due to the resulting deformations of the top layer of material during processing using various technologies. The outline of the profile is obtained during an examination using a diamond needle, and the imprint is recorded on a profilogram. The main parameters characterizing surface roughness have a specific letter designation, used in documentation, drawings and obtained when measuring parts (Rz, Ra, Rmax, Sm, Si, Tp).
To measure surface roughness, several defining parameters are used:
- Ra- denotes the value of the profile under study with possible deviation (arithmetic mean) and is measured in microns;
- Rz – denotes the height of the measured irregularities determined by 10 main points in microns;
- Rmax is the maximum permissible value of the height parameter.
Surface roughness designation
The step parameters Sm and Si and the reference length of the profile under study tp are also used. These parameters are indicated if it is necessary to take into account the operating conditions of the parts. In most cases, the universal indicator Ra is used for measurements, which gives the most complete characteristic taking into account all points of the profile. The value of the average height Rz is used when difficulties arise in determining Ra using instruments. Such characteristics affect the resistance and vibration resistance, as well as the electrical conductivity of materials.
The definition values of Ra and Rz are indicated in special tables and, if necessary, can be used when carrying out the necessary calculations. Typically, the determinant Ra is indicated without a numerical symbol; other indicators have the required symbol. According to current regulations (GOST), there is a scale that gives the values of surface roughness of various parts, which have a detailed breakdown into 14 special classes.
There is a direct relationship that determines the characteristics of the surface being processed; the higher the class indicator, the less important the height of the measured surface is and the better the quality of processing.
Operating principle of profilometers
The devices under consideration can measure roughness indicators using contact and non-contact methods. In the first case, a measuring probe moves along the surface being measured, ending with a hard tip. The vibration amplitude of the probe is amplified and, converted into an electrical signal, measures the roughness index. This option may include optical or laser surface scanning technology.
Profilometer PM-80 MICROTECH.
Most research methods focus specifically on contact profilometers. This is explained by the high accuracy of the result, which can be obtained by reducing the contact area of the diamond needle (sometimes carbide needles are also used). At the same time, when using non-contact optical profilometers, it is necessary to work only with samples whose surface is cleaned of all surface contaminants that distort the measurement results.
Depending on the supplied contact profilometers, they can measure a path with a constant or variable length. The signal conversion method is piezoelectric, inductive or mechatronic.
The sequence of roughness measurements is determined by GOST 2789 and GOST 19300. The accuracy of the profilometers is in the range of ±10…±20%.
What roughness parameters exist?
There are over 8 parameters that characterize the height of surface irregularities. In this article we will analyze only the most popular ones, ignorance of which will be a significant gap for any technical specialist. These are Ra and Rz. The Rz value shows the arithmetic mean of the height taken over 10 surface points. This means that only 5 rises and 5 troughs were involved in the measurement. The rest of the “mountain range” was not taken into account. In the SI system, Rz is measured in micrometers.
Ra is also the arithmetic mean of the roughness height. What distinguishes it from Rz is that not 10 points are taken into account, but all of them. For this reason, the Ra parameter more accurately reflects the roughness of surfaces and is considered more preferable.
In addition to Ra and Rz, it is worth mentioning one more parameter, similar in meaning to the above. This is Rmax. It displays the height of surface irregularities only at its maximum points. According to the greatest height and smallest depression. Currently, Rmax is not used due to its rough accuracy.
Measurement
Roughness is measured in two ways: qualitative and quantitative. The qualitative method for assessing surface roughness is more suitable directly for production workers. In those situations where a deep analysis is not advisable or there is simply no time for it. This method is more crude in nature and consists of comparing the smoothness of the surface under study with a certain standard to the touch.
The standard is a small metal tile with overall dimensions of 30x30 mm and a thickness of 5 mm. It has a certain Ra and Rz value, and is a standard against which the surface quality is compared. Such slabs are collected in sets with the roughness value indicated opposite each position.
The quantitative method is more accurate and requires special equipment for its implementation. These can be profilometers, profilographs and double microscopes. A rod with a diamond tip, highly sensitive to movements, connected to the instruments, is passed along the surface under study. This rod completely repeats the shape of the surfaces and transfers its dimensions to the screen or profilogram tape. Next, based on the data received, the laboratory technician makes an accurate conclusion about the value of roughness and passes it on to the quality service.
What is base length and what is it used for?
Base length l – the length of the base line used to highlight irregularities, characterizing the surface roughness. The base line is drawn relative to the profile of irregularities in a certain way and has a given geometric shape.
What does Ra mean?
Ra is the symbol for the chemical element radium. Ra - designation of surface roughness (arithmetic mean deviation of the profile in microns)
What is RZ in the drawing?
Rz – height of profile irregularities at ten points. Surface roughness is indicated in the drawing for all product surfaces made according to this drawing, regardless of the methods of their formation, except for surfaces whose roughness is not determined by the design requirements.
What is RZ 20?
The sum of the arithmetic mean absolute deviations of the points of the five largest minima and five largest maxima of the profile within the base length. The distance between the line of profile protrusions and the line of profile depressions within the base length.
content .. 51 52 54 ..9. CONTROL OF SURFACE ROUGHNESS
The roughness of the machined surface is controlled by comparison with standard roughness samples, with a certified part or using comparison microscopes, as well as contact and non-contact methods. Comparison methods are widely used in production conditions, and roughness control by comparison with standard samples or with a certified part is used in workshop conditions, at the workplace.
Samples of surface roughness (Fig. 71) are sets of metal bars 2 measuring 30X20 mm, fixed in frames 1 with screws 3. Control of the roughness of the treated surface is carried out visually, by eye, or by touch, running a fingernail across the traces of processing of the part and comparing the results with the results, obtained similarly from the study of standard samples. The material of the standard sample, the shape of its surface and the processing method are of great importance for greater reliability of control, therefore the samples are made from different materials (steel, cast iron) with different surface shapes (flat, cylindrical), processed in different ways under certain modes (turning, milling, grinding, planing, etc.). Samples processed by turning, milling, planing, and reaming are produced unhardened, and those processed by grinding and polishing are hardened.
Rice. 71. Surface roughness samples
Visual or tactile control provides correct results for surfaces with a roughness height of Rz = 10-16 µm (6-8th roughness classes). Roughness parameters are stamped on the sample (zone 4). Roughness samples are prepared for the following types of processing: external turning, internal boring, reaming, face milling, cylindrical milling, planing, cylindrical grinding, flat grinding, face grinding, internal grinding, polishing, finishing. The correctness of the inspection largely depends on the experience and qualifications of the inspector, as well as on the type and intensity of lighting.
An increase in the accuracy of comparison is achieved by using a magnifying glass, which makes it possible to obtain reliable results up to Rz = 0.8 μm (9th class of roughness) or by control on comparison microscopes. The microscope allows you to simultaneously examine the controlled and reference surfaces located in the field of view of the microscope, at the same magnification and the same lighting conditions. The comparison microscope allows you to obtain reliable results up to Rz=0.l µm (12th roughness class).
Roughness assessment using the comparison method is subjective. When using it, disagreements in assessment may arise, to resolve which the surface roughness should be objectively measured using instruments. Measuring roughness parameters using instruments is usually carried out in laboratory conditions to obtain actual values of one or more roughness parameters that are specified in the part drawing.
Surface roughness is measured by contact method using profilometers and profilographs. The operating principle of devices of this type is based on feeling the controlled surface with a diamond needle with a radius of curvature of 10 microns. Profilometers directly show the arithmetic mean deviation of the Ra profile, and profilographs record the surface profile on a diagram.
Rice. 72. Scheme of a profilometer for monitoring surface roughness\
Profilometer mod. 240 (Fig. 72) [3] is arranged as follows. A sensor 14 with a measuring head 13 moves along the rack 15 of the device in a vertical plane. The sensor can be rotated about the horizontal axis to install it parallel to the plane of the part being tested. The measuring head is equipped with a diamond needle 1, mounted on an armature rocker arm 20 mounted on a support 21. The measuring head moves longitudinally at a constant speed using a drive consisting of an electric motor, gearbox, lead screw and slider mounted in the sensor. When the diamond needle moves along the controlled surface 22, the rocker arm 20, together with the armature, makes oscillatory movements, and therefore the air gaps between the armature and the core 3 with two coils 2 and 19 of the inductive device of the device change. As a result, the voltage at the output of the differential transformer 17 changes, which is transmitted to the device 8 through a system of amplifiers, filters and a magnetoelectric control device 18. The voltage on the device 18 is proportional to the height of the micro-irregularities of the controlled surface. Device 18 shows the value of the arithmetic mean deviation of the Ra profile.
On the front panel of the electronic unit 9, in addition to device 8, there is a control device 6, a toggle switch for turning on the network 11, a signal lamp for turning on the network 10, a switch for measurement limits 5, and potentiometer knobs. Setting 7 and button 12 for turning on the sensor drive. The device is powered from a stabilized power supply 16 through a generator 4. After the needle of the device 8 deviates by a certain angle, it stops and will remain in this position until the next time the profilometer is adjusted to zero.
Profilometers (mod. 240, 253) allow you to measure surface roughness according to the parameter Ra = 2.5-s—j-0.04 μm (6-12th roughness classes). Profilometer mod. 240 is used to measure roughness in workshop conditions. The profilometer-profiler (mod. 201) has, in addition to the display device, also a recording device that allows you to draw the actual profile of the surface roughness with a vertical magnification of 1000-200,000 and a horizontal magnification of 2-4000. The device is intended for laboratory measurements of roughness and allows you to measure the parameter Ra = 5-0.04 µm (5-12th roughness classes) with fixation on the indicating device, and according to the recorded profilogram Ra = 5 - 0.01 µm (5-14- th roughness classes). The profilometer also allows you to measure all other parameters of surface roughness.
The profilometer sensor is equipped with a number of replaceable supports that allow you to measure the roughness of flat external and internal cylindrical surfaces. The device is designed to measure the surface roughness of holes with a diameter of more than 8 mm. More advanced is the profilometer-profiler mod. 202, which has an extended range of vertical movements and is designed to measure the roughness of curved surfaces, including the profile of gear teeth, as well as the surface roughness of small holes with a diameter of more than 3 mm to a depth of 5 mm.
In some cases, it is impossible to control the roughness of a hard-to-reach surface of a part using conventional measuring tools. In such cases, the cast method is used. The mass made according to a special recipe is applied to the treated surface and pressed tightly. After hardening, the mass is easily separated, and the unevenness of the controlled surface is repeated in the form of an imprint. By measuring the surface roughness of the impression, the roughness parameters of the surface being tested are determined.
Control methods
To control surface roughness, two methods are used:
- qualitative;
- quantitative.
When carrying out qualitative control, a comparative analysis of the surface of the working test and standard samples is carried out by visual inspection and by touch. To carry out the research, special sets of surface samples are produced that have routine processing in accordance with GOST 9378-75. Each sample is marked indicating the Ra index and the method of influencing the surface layer of the material (grinding, turning, milling, etc.). Using visual inspection, it is possible to fairly accurately characterize the surface layer with characteristics Ra = 0.6-0.8 µm and higher.
Surface roughness samples
Quantitative surface control is carried out using instruments using different technologies:
- profilometer;
- profiler;
- double microscope.
Rating of quality profilometers
Optical 3D profilometers
Profile 3D
Model produced by the American company Filmerics. A low-cost 3D roughness imaging product that uses two optical interference techniques, white light interferometry (WLI) and phase shift interferometry (PSI), to determine the degree of surface roughness. It is used in mechanical engineering, materials science, energy, forensics, microelectronics, optics, etc.
Research is carried out in the range from subnanometer to millimeter with minimal costs and labor costs.
The device is equipped with a stage with drives for movement in the X and Y axes, a wide-angle lens with 10x magnification, and a 5 megapixel camera. Capable of producing accurate scanning results with part thicknesses from 50nm to 10mm (WLI) and from 0 to 3 μm (PSI).
On a note! In the international system of units of measurement, μm stands for micrometer.
The error does not exceed 0.7%. Vertical scanning is performed at a speed of 12 μm/sec. The price is to be confirmed with the seller.
Profilm 3D profilometer
Advantages:
- simple;
- reliable;
- accurate;
- inexpensive.
Flaws:
- results are not transferred to the PC.
4.Optical profilometers of the Surfiew Academy series
GL-tech company from South Korea develops and produces white scanning interferometers. The review presents the Surfiew Academy model, which is capable of instantly and with high accuracy determining surface roughness parameters in the range from 1 nanometer to 10 mm.
On a note! In the international system of units, infinitesimal lengths, incl. The wavelengths of visible light are measured in millionths of a meter or nanometers (nm).
The process is much faster than using the confocal method and occurs without damaging the samples under study. The software allows you to convert a 3D image into a 2D format (3D rendering), perform a mathematical analysis of the nature of irregularities: chips, cracks, etc. Linear and area scanning available. Visualization of the process is displayed on the display screen.
Measuring tools of this type are used to assess the roughness of parts after particularly precise processing. The device is equipped with a 0.5-inch single-color camera and white LED backlight. The object table, measuring 12x12 cm, is moved manually. The price is to be confirmed with the seller.
profilometer Optical profilometers of the Surfiew Academy series
Advantages:
- speed of operations;
- high accuracy of results;
- three-dimensional picture.
Flaws:
- solid dimensions and weight;
- requires highly qualified operator.
3.Optical profilometer Swift PRO Duo
Model produced by the British company Vision Engineering Ltd. It is a powerful and simple system for analyzing the roughness of various surfaces. The multi-purpose device uses modern methods of optical analysis and video technologies, allowing it to be successfully used on the production site and within the walls of laboratories.
The impressive functionality makes it possible to use the device in electronics and automotive manufacturing, medical equipment production and the aerospace field.
Swift PRO Duo controls are distinguished by a clear interface, high measurement accuracy in accordance with international standards, 100x magnification of the real image, ease of settings and use. The cost is to be confirmed with the seller.
profilometer Optical profilometer Swift PRO Duo
Advantages:
- ease of use;
- greater measurement accuracy;
- presence of a video camera;
- multifunctionality.
Flaws:
- not identified.
LEICA DCM8 SR
The confocal 3D profilometer from the German manufacturer Leica Microsystems receives the best reviews. The device implements the capabilities of a confocal microscope and an interferometer. In combination with additional functions, this design quickly and accurately determines and displays on the screen the characteristics of the test sample. The results are documented using an image recording system based on a built-in CCD camera and four LEDs.
The device's confocal capabilities facilitate fast and accurate profile analysis of complex surfaces as long as their inclination does not exceed 70°. The device is equipped with a highly sensitive detector (1.4 million pixel resolution), which allows viewing research results in confocal and bright-field modes with a high degree of contrast and focus.
The device has dimensions (height, width, length) of 573x390x569 mm and a weight of 48 kg, and is operated in the ambient temperature range from +10 to +35°C and relative humidity no more than 80%. Implements a number of functions:
- obtaining a 3D relief image;
- determination of profile characteristics with coordinates, thickness, roughness;
- carrying out spectral analysis and colorimetry.
The cost of the device is confirmed with the seller.
profilometer LEICA DCM8 SR
Advantages:
- mathematical image analysis;
- high-definition interferometric study;
- the ability to obtain color images of the results (RGB palette) from four LEDs;
- simple software.
Flaws:
- high price.
1.S neox – 3D optical profilometer-confocal microscope
A new product in the line of devices from the Spanish company Sensofar, it combines the capabilities of a three-dimensional optical profilometer and a confocal microscope. The product is used in various fields:
- in mechanical engineering and aerospace;
- materials science and energy;
- criminology;
- microelectronics and micromechanics;
- optics and semiconductors;
- consumer electronics;
- display manufacturing and watch industry.
The model implements technologies of confocal microscopy, interferometry, and focus measurement. A revolving mechanism with six lenses is used as the main working body. In addition, the equipment includes: a high-resolution camera combined with a display, four LEDs (red, green, blue and white), supporting moving tables of various sizes, including one with manual movement and four with electric drive. The price is to be confirmed with the seller.
profilometer S neox – 3D optical profilometer-confocal microscope
Advantages:
- multifunctional;
- results are fast and accurate;
- compact sizes.
Flaws:
- not identified.
Optical profilometers at an affordable price
5.Optical profilometer MicroProf 100
A small-sized device made in Taiwan for monitoring surface roughness in a non-contact manner. It is interesting because it can simultaneously determine the relief of both planes of the plate under study, i.e. front and back sides of the part. Moreover, the device is capable of determining several parameters at once: roughness, waviness and flatness, as well as examining the difference in thickness over the entire area of the sample and also on both sides.
The device is a desktop version; at the customer’s request, it can be made in a portable version for working with samples on site. The manufacturer assures that the device is quite affordable, but this information needs to be clarified with the seller.
profilometer Optical profilometer MicroProf 100
Advantages:
- compact dimensions;
- multifunctionality;
- double-sided scanning system;
- affordable price.
Flaws:
- not identified.
4.Optical profilometer TAMS
Japanese device for determining roughness from Konica Minolta. Compact, portable, contactless device. Developed in collaboration with the German concerns Volkswagen and Audi. Capable of determining with high accuracy the roughness of the finishing of passenger car bodies in the range from initial matte to final glossy. Using this device, intermediate stages of coating application and processing are controlled: steel, aluminum, E-Coat coating, main and finishing.
On a note! Electrodeposition coating of metal surfaces is called E-Coat.
The model is light and compact. The lower part is an optical scanner. The top of the product is the control panel. Working with the device does not require highly qualified operator. The operating training process lasts exactly as long as it takes to familiarize yourself with the user manual. The price is affordable, but you will have to check it with the seller.
profilometer Optical profilometer TAMS
Advantages:
- simple and intuitive controls;
- lightness and compactness;
- fast and accurate results;
- affordable price.
Flaws:
- not identified.
BW-series
The device determines the level of cleanliness of product processing using modern non-contact technologies: 3D optical and interferometric. Multifunctional, analyzes thin layers, sample geometry, suitable for observing deformation processes.
Suitable for industrial use and laboratory research. Can be used as an optical microscope. Performs studies of smooth and rough samples without changing the operating mode. It operates in a non-contact manner, does not destroy the surface of the sample, and scans at high speed. Has compact dimensions. The average price is quite affordable. The final size will be confirmed with the seller.
profilometer BW-series
Advantages:
- quick results;
- non-destructive research methods;
- compact dimensions;
- affordable price.
Flaws:
- not identified.
2.Smart Projector 224
Optical profilometer from the Italian company SmartVision. Designed to check surface roughness. Measurements are carried out automatically and at high speed. An excellent tool for incoming, periodic and continuous product quality control. Does not require highly qualified operator.
Package Included:
- multifunctional PC (touch screen with high image quality);
- light receiver with double telecentric lens;
- camera with dimensions 419x450x475 mm.
The weight of the equipment is 150 kg. The price is to be confirmed with the seller.
profilometer Smart Projector 224
Advantages:
- contactless technology;
- high speed;
- accurate results;
- does not require highly qualified operator.
Flaws:
- large weight and dimensions.
Basic rules used to indicate surface roughness in drawings
Basic rules to use when making a drawing:
- The drawing indicates all surface roughness for the material used without taking into account the methods used.
- The application of roughness values is carried out on sections that have a size.
- Signs are applied to all types of lines used in the drawing.
- If a sign has a shelf, its location is determined in relation to the main inscription.
- If the product has a gap in the drawing, then only one part of the image is marked.
- If the surface layer requires the use of processing sections of a part of different classes, then division is made using a solid line.
- In case of reducing the space required for marking on the drawing, an acceptable simplification of the symbols is possible.
- If the contour surface roughness value is the same, the value is applied once.
- If different surfaces with the same roughness values are identical, it is allowed to apply the values once.
- Signs indicating irregularities must be 1.5 times thicker than those printed on the image.
- Conditions indicating the direction of surfaces must comply with the standards.
- The designation of surface roughness is made using general rules.
Designations for the direction of surface roughness in drawings
Taking into account the structure of the material, the designer has the opportunity to specify the necessary parameters for the quality of surfaces. Moreover, the characteristics can be specified according to several parameters, setting the maximum and minimum values with possible tolerances.
How to choose roughness?
Choosing roughness is not as complicated a process as it might seem. Everywhere I have worked, and my friends do the same, the default roughness is Ra6.3 for all surfaces where there are no specific instructions on the smoothness of the surface. For smoother surfaces, such as polished ones, the roughness value can range from 3.2 to 0.1. You need to look at the target accessory of the part. For example, if a cooled radiator is applied to the surface for which the roughness is indicated, then it must be made smooth - Ra1.6. During all my work, I have seen the use of only four roughness options:
- 6.3 everywhere
- 3.2 in neater places, such as rubber seal grooves
- 1.6 in places of contact of cooled surfaces
- 0.8 in places where the surface was polished (laser technology)
When trying to consider this issue on the Internet, you can find many different pictures with theory, where a tricky part is drawn with all possible types of processing and roughnesses for these types are indicated. It is characteristic that in all these pictures the numbers appear to be the same, but their ranges are different. In any case, for the general concept of correct roughness setting, the list above will be sufficient, but for more tricky details you should study the requirements that apply to them specifically at the enterprise or by the customer.
Where can I buy
The easiest way is to purchase the necessary device in a specialized store or wholesale organization. Their addresses are easy to find on the Internet. Here you can not only see the product in person, but also test it, get acquainted with the manufacturer’s warranty obligations and get advice from the seller.
If this is not possible, all you have to do is order the product online from an online store. It is better if this is the site of the manufacturer of this equipment. In this case, you can be sure that you will receive the tool that you ordered, complete with a completed warranty card.
If the price seems prohibitive, you can try to find a used device at a virtual sale like Avito.
Special conditions
During mass production of certain parts, the specified shape or their conjugation is sometimes violated. Such violations increase the permissible wear of parts, and are limited by special tolerances, which are specified in GOST 2.308-2011. Each type of tolerance used has 16 defining degrees of accuracy, which are specified for parts of different configurations, taking into account the material used. It is also necessary to take into account that the size and configuration tolerances used for parts with a cylindrical shape are taken taking into account the diameter of the parts, and for flat parts taking into account the thickness, and the maximum error should not exceed the tolerance value.
Sources
- https://vt-metall.ru/articles/436-klassy-chistoty-obrabotki-metalla
- https://engineerscreed.ru/sherohovatost-poverhnosti/
- https://morflot.su/sherohovatost-poverhnosti-ra-i-rz-otlichie/
- https://osntm.ru/scherochowatost.html
- https://lfirmal.com/sherohovatost-poverhnosti-4/
- https://crast.ru/instrumenty/sherohovatost-ra-i-rz-v-chem-raznica
- https://vologda-yel.ru/chto-oznachaet-znak-sherohovatosti-v-skobkah/
- https://sakhkor.ru/tehnologii/tablica-sherohovatosti-poverhnosti.html