For any industry that is in one way or another connected with metals, from purchasing to a metallurgical plant, the composition of raw materials is important. Metals and alloys must meet certain parameters both in order to produce a high-quality product and in order to be able to objectively assess the cost of the material being purchased. One of these parameters is chemical analysis of the composition, which can be performed without resorting to complex reagents and lengthy processes.
One method to determine the exact composition of a metal is spectral analysis. It is based on the interaction of matter with a spectrum of radiation, including electromagnetic and acoustic. The atoms of each chemical element have their own resonant frequencies at which they emit or absorb light. The number and intensity of the lines that the spectrometer shows depends on the quantity and state of the substance. Depending on the purposes, different methods of spectral analysis are carried out.
Brief overview of methods
Analysis of metal composition by traditional methods of analytical chemistry is based on the ability to interact with reagents. The procedure includes sample preparation, weighing, titration; requires effort and time. Nowadays, chemical analysis of metal by classical analytical research is rarely carried out in practice. Determination of composition based on physical phenomena is fast and efficient. Thus, the frequently used spectral analysis of alloys has the following advantages:
- • efficiency of execution: • minimum number of auxiliary devices; • maximum accuracy of values; • ease of implementation; • possibility of carrying out in field and stationary conditions.
Reliable chemical analysis of the metal is carried out using modern spectral equipment that records the intensity of emission waves. Emission spectrometers of the domestic brand are reliable, easy to use, and affordable. Spectral analysis of steel and other materials is highly accurate and is used for certification.
Emission characteristics of the substance
The study of emission spectra of material components can be promising from the point of view of rapid analysis and low detection thresholds, reaching thousandths of a percent or less. Common sources are AC or DC electrical arcs, sparks, as well as glow discharges and inductively coupled plasmas. Lines of charge-coupled devices are widely used as detectors, allowing for informative visualization of the emission spectrum after light conversion using a diffraction grating.
The essence and possibilities of atomic emission measurements
Spectral analysis of metals is based on the ability of atoms to emit waves as a result of excitation. The process initiates spark, laser, arc, and other influences. The excitation source is located in the generator - the spectrometer unit, which can be easily replaced if necessary. The emission analyzer measures the intensity of optical waves emitted by atoms after transitioning to an excited state. Based on the wavelength and peak size in the spectrum, a chemical element is automatically identified and its concentration is calculated. Atomic emission spectroscopy allows you to analyze substances in various states of aggregation. A minimum amount of material is required for measurements. Through analysis on a stationary or mobile spectrometer, the grade of steel and the degree of purity of metals are determined; perform chemical analysis of metal alloys. The devices can determine the mass fractions of elements with a detection limit of 0.0001%
Spectral analysis
Details Category:
SPECTRAL ANALYSIS
(using emission spectra) is used in almost all sectors of the economy. Widely used in the metal industry for the rapid analysis of iron, steel, cast iron, as well as various special steels and finished metal products, to determine the purity of light, non-ferrous and precious metals. Spectral analysis is widely used in geochemistry when studying the composition of minerals. In the chemical industry and related industries, spectral analysis is used to determine the purity of manufactured and used products, to analyze catalysts, various residues, sediments, turbidities and wash waters; in medicine - for the discovery of metals in various organic tissues. A number of special problems that are difficult to solve or cannot be solved in any other way are solved using spectral analysis quickly and accurately. This includes, for example, the distribution of metals in alloys, the study of sulfide and other inclusions in alloys and minerals; This type of research is sometimes referred to as local analysis.
The choice of one or another type of spectral apparatus from the point of view of the sufficiency of its dispersion is made depending on the purpose and objectives of spectral analysis. Quartz spectrographs with greater dispersion, giving for wavelengths 4000-2200 Ӑ a strip of spectrum at least 22 cm long. For other elements it could be Apparatuses have been used that produce spectra 7-15 cm long. Spectrographs with glass optics are generally of less importance. Of these, combined instruments are convenient (for example, from the companies of Hilger and Fuss), which, if desired, can be used as a spectroscope and spectrograph. The following energy sources are used to obtain spectra. 1) The flame of a burning mixture - hydrogen and oxygen, a mixture of oxygen and lighting gas, a mixture of oxygen and acetylene, or finally air and acetylene. In the latter case, the temperature of the light source reaches 2500-3000°C. The flame is most suitable for obtaining spectra of alkali and alkaline earth metals, as well as for elements such as Cu, Hg and Tl. 2) Voltaic arc. a) Ordinary, ch. arr. direct current, power 5-20 A. It is used with great success for the qualitative analysis of difficult-to-fuse minerals, which are introduced into the arc in the form of pieces or finely ground powders. For the quantitative analysis of metals, the use of a conventional voltaic arc has a very significant drawback, namely, that the surface of the analyzed metals is covered with an oxide film and the arc combustion ultimately becomes uneven. The temperature of the voltaic arc reaches 5000–6000°C. b) Intermittent arc (Abreissbogen) of direct current with a power of 2-5 A at a voltage of about 80 V. Using a special device, the arc is interrupted 4-10 times per second. This method of excitation reduces oxidation of the surface of the analyzed metals. At higher voltages - up to 220 V and a current of 1-2 A - an intermittent arc can also be used for the analysis of solutions. 3) Spark discharges obtained using an induction coil or, more often, a DC or (preferably) alternating current transformer with a power of up to 1 kW, giving 10,000-30,000 V in the secondary circuit. Three types of discharges are used, a) Spark discharges without capacitance and inductance in secondary circuit, sometimes called high voltage arc (Hochspannungsbogen). The analysis of liquids and molten salts using such discharges is highly sensitive.
b) Spark discharges with capacitance and inductance in the secondary circuit, often also called condensed sparks, represent a more universal source of energy, suitable for exciting the spectra of almost all elements (except alkali metals), as well as gases. The connection diagram is shown in Fig. 1,
where R is the rheostat in the primary circuit, Tr is the AC transformer, C1 is the capacitance in the secondary circuit I, S is the switch for changing the inductance L1, U is the synchronous breaker, LF is the spark arrester, F is the working spark gap. The secondary circuit II is tuned into resonance with the secondary circuit I using inductance and variable capacitance C2; a sign of the presence of resonance is the highest current strength shown by milliammeter A. The purpose of the secondary circuit II of the synchronous breaker U and the spark arrester LF is to make electrical discharges as uniform as possible both in character and in number over a certain period of time; during normal work such additional devices are not introduced.
When studying metals in the secondary circuit, a capacitance of 6000-15000 cm3 and an inductance of up to 0.05-0.01 N are used. For the analysis of liquids, a water rheostat with a resistance of up to 40,000 Ohms is sometimes introduced into the secondary circuit. Gases are studied without inductance with a small capacitance. c) Tesla current discharges, which are carried out using the circuit shown in Fig. 2,
where V is a voltmeter, A is an ammeter, T is a transformer, C is a capacitance, T-T is a Tesla transformer, F is the spark gap where the analyzed substance is introduced. Tesla currents are used to study substances that have a low melting point: various plant and organic preparations, deposits on filters, etc. In the spectral analysis of metals, in the case of a large number of them, they usually themselves are electrodes, and they are given some form, for example, from those shown in FIGS. 3,
where a is an electrode made from the thick wire being analyzed, b is from tin, c is a bent thin wire, d is a disk cut from a thick cylindrical rod, e is a shape cut from large pieces of casting. In quantitative analysis, it is always necessary to have the same shape and size of the electrode surface exposed to sparks. If the amount of metal being analyzed is small, you can use a frame made of some pure metal, for example, gold and platinum, in which the analyzed metal is fixed, as shown in Fig. 4.
Quite a few methods have been proposed for introducing solutions into a light source. When working with a flame, a Lundegaard atomizer is used, schematically shown in Fig. 5 together with a special burner.
The air blown through the sprayer BC captures the test liquid, poured in an amount of 3-10 cm3 into recess C, and carries it in the form of fine dust to burner A, where it is mixed with gas. To introduce solutions into the arc, as well as into the spark, clean carbon or graphite electrodes are used, on one of which a recess is made. It should be noted, however, that it is very difficult to cook coals completely clean. The methods used for cleaning - alternate boiling in hydrochloric and hydrofluoric acids, as well as calcination in a hydrogen atmosphere to 2500-3000 ° C - do not produce coals free of impurities; Ca, Mg, V, Ti, Al remain (albeit traces), Fe, Si, V.
Coals of satisfactory purity are also obtained by calcining them in air using an electric current: a current of about 400 A is passed through a carbon rod with a diameter of 5 mm, and the strong incandescence achieved in this way (up to 3000 ° C) is sufficient to ensure that within a few seconds Most of the impurities contaminating the coals have evaporated. There are also methods for introducing solutions into a spark, where the solution itself is the lower electrode, and the spark jumps to its surface; another electrode can be any pure metal. An example of such a device is shown in Fig. 6 Gerlyach liquid electrode.
The recess into which the test solution is poured is lined with platinum foil or covered with a thick layer of gold. In fig. 7 shows a Hitchen apparatus, which also serves to introduce solutions into a spark.
From vessel A, the test solution flows in a weak stream through tube B and quartz nozzle C into the sphere of action of spark discharges. The lower electrode, soldered into a glass tube, is attached to the apparatus using a rubber tube E. The attachment C, shown in Fig. 7 separately, has a cutout on one side for mortar walling. D - a glass safety vessel in which a round hole is made to allow ultraviolet rays to escape. It is more convenient to make this vessel quartz without a hole. The top electrode F, graphite, carbon or metal, is also fitted with a splash-proof plate. For a “high-voltage arc” that strongly heats the analyzed substances, Gerlach uses cooled electrodes when working with solutions, as shown schematically in Fig. 8.
A glass funnel G is attached to a thick wire (6 mm in diameter) using a stopper K, into which pieces of ice are placed. At the upper end of the wire, a round iron electrode E with a diameter of 4 cm and a height of 4 cm is fixed, on which a platinum cup P is placed; the latter should be easily removable for cleaning.
The top electrode should also be used. thick to avoid melting. When analyzing small quantities of substances - sediments on filters, various powders, etc. - you can use the device shown in Fig. 9.
A lump is made from the test substance and filter paper, moistened for better conductivity with a solution, for example, NaCl, placed on the lower electrode, sometimes consisting of pure cadmium, enclosed in a quartz (worse glass) tube; the top electrode is also some pure metal. For the same analyzes when working with Tesla currents, a special spark gap design is used, shown in Fig. 10 a and b.
In the round hinge K, an aluminum plate E is fixed in the desired position, on which a glass plate G is placed, and on the latter - preparation P on filter paper F. The preparation is moistened with some acid or salt solution. This entire system is a small capacitor. To study gases, closed glass or quartz vessels are used (Fig. 11).
For quantitative analysis of gases, it is convenient to use gold or platinum electrodes, the lines of which can be used for comparison. Almost all of the above-mentioned devices for introducing substances into a spark and arc are mounted in special stands during operation. An example is the Gramont tripod shown in Fig. 12:
using screw D, the electrodes are simultaneously moved apart and moved apart; screw E is used to move the upper electrode parallel to the optical bench, and screw C is for lateral rotation of the lower electrode; screw B is used for lateral rotation of the entire upper part of the tripod; finally, using screw A, you can raise or lower the entire upper part of the tripod; N - stand for burners, glasses, etc. The choice of energy source for a particular research purpose can be made using the following approximate table.
Qualitative analysis. In qualitative spectral analysis, the discovery of an element depends on many factors: the nature of the element being determined, the energy source, the resolution of the spectral apparatus, as well as the sensitivity of photographic plates. Regarding the sensitivity of the assay, the following guidelines can be made. When working with spark discharges in solutions, you can open 10-9-10-3%, and in metals 10-2-10-4% of the element under study; when working with a voltaic arc, the opening limits are about 10-3%. The absolute amount that can be open when working with a flame, is 10-4-10-7 g, and with spark discharges 10-6-10-8 g of the element under study. The greatest sensitivity of discovery applies to metals and metalloids - B, P, C; less sensitivity for metalloids As, Se and Te; halogens, as well as S, O, N in their compounds, cannot be used at all. open and m.b. discovered only in some cases in gas mixtures.
For qualitative analysis, the “last lines” are of greatest importance, and in the analysis the task is to most accurately determine the wavelengths of the spectral lines. In visual studies, wavelengths are measured along the spectrometer drum; these measurements can be considered only approximate, since the accuracy is usually ±(2 - 3) Ӑ and in the Kaiser tables this error interval can correspond to about 10 spectral lines belonging to different elements for λ 6000 and 5000 Ӑ and about 20 spectral lines for λ ≈ 4000 Ӑ. The wavelength is determined much more accurately by spectrographic analysis. In this case, on the spectrograms, using a measuring microscope, the distance between lines with a known wavelength and a determined one is measured; Hartmann's formula is used to find the wavelength of the latter. The accuracy of such measurements when working with an instrument that produces a spectrum strip about 20 cm long is ± 0.5 Ӑ for λ ≈ 4000 Ӑ, ± 0.2 Ӑ for λ ≈ 3000 Ӑ and ± 0.1 Ӑ for λ ≈ 2500 Ӑ. The corresponding element is found in the tables based on the wavelength. The distance between lines during normal work is measured with an accuracy of 0.05-0.01 mm. This technique is sometimes conveniently combined with shooting spectra with so-called Hartmann shutters, two types of which are shown in Fig. 13, a and b; With their help, the spectrograph slit can be made of different heights. Fig. 13, c schematically depicts the case of qualitative analysis of substance X - the establishment of elements A and B in it. The spectra of Fig. 13, d show that in substance Y, in addition to element A, the lines of which are designated by the letter G, there is an impurity, the lines of which are designated z. Using this technique, in simple cases, you can perform a qualitative analysis without resorting to measuring the distances between lines.
Quantitative analysis. For quantitative spectral analysis, lines that have the greatest possible concentration sensitivity dI/dK are of greatest importance, where I is the intensity of the line, and K is the concentration of the element giving it. The greater the concentration sensitivity, the more accurate the analysis. Over time, a number of methods for quantitative spectral analysis have been developed. These methods are as follows.
I. Spectroscopic methods (without photography) are almost all photometric methods. These include: 1) Barratt's method. At the same time, the spectra of two substances are excited - the test substance and the standard one - visible in the field of view of the spectroscope side by side, one above the other. The path of the rays is shown in Fig. 14,
where F1 and F2 are two spark gaps, the light from which passes through Nicolas prisms N1 and N2, polarizing the rays in mutually perpendicular planes. Using prism D, the rays enter the slit S of the spectroscope. A third Nicolas prism, an analyzer, is placed in his telescope, rotating which achieves equal intensity of the two lines being compared. Previously, when studying standards, i.e. substances with known contents of elements, the relationship between the angle of rotation of the analyzer and the concentration is established, and a diagram is drawn from this data. When analyzing by the angle of rotation of the analyzer, the desired percentage is found from this diagram. The accuracy of the method is ±10%. 2) Scheibe and Limmer method. The principle of the method is that light rays after the spectroscope prism pass through a Wollaston prism, where they diverge into two beams and are polarized in mutually perpendicular planes. The ray path diagram is shown in Fig. 15,
where S is the slit, P is the spectroscope prism, W is the Wollaston prism. In the field of view, two spectra B1 and B2 are obtained, lying next to each other; L - magnifying glass, N - analyzer. If you rotate the Wollaston prism, the spectra will move relative to each other, which allows you to combine any two of their lines. For example, if iron containing vanadium is analyzed, then the vanadium line is combined with some nearby single-color iron line; then, by turning the analyzer, they achieve the same brightness of these lines. The angle of rotation of the analyzer, as in the previous method, is a measure of the concentration of the desired element. The method is especially suitable for the analysis of iron, the spectrum of which has many lines, which makes it possible to always find lines suitable for research. The accuracy of the method is ± (3-7)%. 3) Occhialini method. If the electrodes (for example, the metals being analyzed) are placed horizontally and the image is projected from a light source onto the vertical slit of the spectroscope, then both during spark and arc discharges, lines of impurities may appear. open depending on the concentration at a greater or lesser distance from the electrodes. The light source is projected onto the slit using a special lens equipped with a micrometric screw. During analysis, this lens moves and the image of the light source moves along with it until any impurity line in the spectrum disappears. The measure of impurity concentration is the reading on the lens scale. Currently, this method has also been developed for working with the ultraviolet part of the spectrum. It should be noted that Lockyer used the same method of illuminating the slit of a spectral apparatus and he developed a method of quantitative spectral analysis, the so-called. "long and short lines" method. 4) Direct photometry of spectra. The methods described above are called visual. Instead of visual studies, Lundegaard used a photocell to measure the intensity of spectral lines. The accuracy of determining alkali metals when working with a flame reached ± 5%. For spark discharges, this method is not applicable, since they are less constant than flames. There are also methods based on changing the inductance in the secondary circuit, as well as using artificial attenuation of the light entering the spectroscope until the spectral lines under study disappear in the field of view.
II. Spectrographic methods. With these methods, photographic photographs of spectra are examined, and the measure of the intensity of the spectral lines is the blackening they produce on the photographic plate. The intensity is assessed either by eye or photometrically.
A
. Methods without the use of photometry. 1) Last lines method. When the concentration of any element in the spectrum changes, the number of its lines changes, which makes it possible, under constant operating conditions, to judge the concentration of the element being determined. A series of spectra of substances with a known content of the component of interest are photographed, the number of its lines is determined on the spectrograms, and tables are compiled indicating which lines are visible at given concentrations. These tables further serve for analytical definitions. When analyzing the spectrogram, the number of lines of the element of interest is determined and the percentage content is found from the tables, and the method does not give an unambiguous figure, but the limits of the limit. It is most reliably possible to distinguish concentrations that differ from each other by a factor of 10, for example, from 0.001 to 0.01%, from 0.01 to 0.1%, etc. Analytical tables are important only for very specific operating conditions, which may vary greatly between laboratories; In addition, careful adherence to constant working conditions is required. 2) Method of comparative spectra. Several spectra of the analyzed substance A + x% B are photographed, in which the content of x element B is determined, and in the intervals between them on the same photographic plate - spectra of standard substances A + a% B, A + b% B, A + c% B , where a, b, c are the known percentage of B. In the spectrograms, the intensity of the B lines determines between which concentrations the value of x lies. The criterion for the constancy of operating conditions is the equality of intensity in all spectrograms of any nearby line A. When analyzing solutions, the same amount of some element is added to them, giving a line close to lines B, and then the constancy of operating conditions is judged by the equality of the intensity of these lines. The smaller the difference between the concentrations of a, b, c, ... and the more accurately the equality of the intensity of lines A is achieved, the more accurate the analysis. A. Rice, for example, used concentrations of a, b, c, ..., related to each other as 1: 1.5. Adjacent to the method of comparative spectra is the method of “selection of concentrations” (Testverfahren) according to Güttig and Thurnwald, which is applicable only to the analysis of solutions. It lies in the fact that if in two solutions containing a% A and x% A (x is greater or less than a), which can now be determined from their spectra, then such an amount n of the element A is added to any of these solutions so that the intensity of its lines in both spectra becomes the same. This will determine the concentration x, which will be equal to (a ± n)%. You can also add some other element B to the analyzed solution until the intensities of certain lines A and B are equal and, based on the amount of B, estimate the content of A. 3) Method of homologous pairs. In the spectrum of a substance A + a% B, the lines of elements A and B are not equally intense and, if there are a sufficient number of these lines, you can find two such lines A and B, the intensity of which will be the same. For another composition A + b% B, other lines A and B will be equal in intensity, etc. These two identical lines are called homologous pairs. The concentrations of B at which one or another homologous pair occurs are called the fixing points of this pair. To work using this method, preliminary compilation of tables of homologous pairs using substances of known composition is required. The more complete the tables, i.e., the more homologous pairs they contain with fixing points that differ as little as possible from each other, the more accurate the analysis. Quite a large number of these tables have been compiled, and they can be used in any laboratory, since the conditions of the discharges during their compilation are precisely known and these conditions can be used. absolutely accurately reproduced. This is achieved using the following simple technique. In the spectrum of substance A + a% B, two lines of element A are selected, the intensity of which varies greatly depending on the value of self-induction in the secondary circuit, namely one arc line (belonging to the neutral atom) and one spark line (belonging to the ion). These two lines are called a fixing pair. By selecting the value of self-inductance, the lines of this pair are made identical and the compilation is carried out precisely under these conditions, always indicated in the tables. Under the same conditions, the analysis is carried out, and the percentage is determined based on the implementation of one or another homologous pair. There are several modifications of the homologous pair method. Of these, the most important is the auxiliary spectrum method, used in the case when elements A and B do not have a sufficient number of lines. In this case, the spectral lines of element A are connected in a certain way with the lines of another, more suitable element G, and the role of A begins to be played by element G. The method of homological pairs was developed by Gerlyach and Schweitzer. It is applicable to both alloys and solutions. Its accuracy is on average about ±10%.
IN
. Methods using photometry. 1) Barratt method. Fig. 16 gives an idea of the method.
F1 and F2 are two spark gaps, with the help of which the spectra of the standard and the analyzed substance are simultaneously excited. Light passes through 2 rotating sectors S1 and S2 and, using prism D, forms spectra that are located one above the other. By selecting sector cuts, the lines of the element under study are given the same intensity; the concentration of the element being determined is calculated from the ratio of the values of the cuttings. 2) The Scheibe and Schmidt method is similar, but with one spark gap (Fig. 17).
The light from F is divided into two beams and passes through sectors S1 and S2, using the Hüfner rhombus R two bands of the spectrum are obtained one above the other; Sp is the spectrograph slit. The sector cuts are changed until the intensity of the impurity line and any nearby line of the main substance are equal, and the percentage content of the element being determined is calculated from the ratio of the cut values. 3) When using a rotating logarithmic sector as a photometer, the lines obtain a wedge-shaped appearance on the spectrograms. One of these sectors and its position relative to the spectrograph during operation is shown in Fig. 18, a and b.
The sector cutting obeys the equation
— log Ɵ = 0.3 + 0.2l
where Ɵ is the length of the arc in parts of a complete circle, located at a distance I, measured in mm along the radius from its end. A measure of the intensity of the lines is their length, since with a change in the concentration of an element, the length of its wedge-shaped lines also changes. First, using samples with known content, a diagram is constructed of the dependence of the length of a line on the % content; When analyzed on a spectrogram, the length of the same line is measured and the percentage is found from the diagram. There are several different modifications of this method. It is worth pointing out the modification of Scheibe, who used the so-called. double logarithmic sector. A view of this sector is shown in Fig. 19.
The lines are then examined using a special apparatus. Accuracy achievable using logarithmic sectors, ±(10-15)%; Scheibe's modification gives an accuracy of ±(5-7)%. 4) Quite often, photometry of spectral lines is used using light and thermoelectric spectrophotometers of various designs. Thermoelectric photometers, designed specifically for the purpose of quantitative analysis, are convenient. For example in FIG. Figure 20 shows a diagram of the photometer according to Sheibe:
L is a constant light source with condenser K, M is a photographic plate with the spectrum being studied, Sp is a slit, O1 and O2 are lenses, V is a shutter, Th is a thermoelement that is connected to the galvanometer. A measure of the intensity of the lines is the deflection of the galvanometer needle. Less commonly used are self-registering galvanometers, which record the intensity of lines in the form of a curve. The accuracy of analysis when using this type of photometry is ±(5-10)%. When combined with other methods of quantitative analysis, the accuracy may be increased; for example, the three-line method of Scheibe and Schnettler, which is a combination of the method of homologous pairs and photometric measurements, in favorable cases can give an accuracy of ±(1-2)%.
Source: Martens. Technical encyclopedia. Add. volume - 1936
- < Back
- Forward >
Additional devices for working with optical emission equipment
Spectral analysis of metals and alloys with laser initiation is carried out in an atmosphere of extremely pure argon. If the degree of gas purification is unsatisfactory, it must be further purified. The laboratory for spectral analysis of metals must be equipped with a device for additional gas purification. The unit allows you to bring to an ideal state not only argon, but also helium, nitrogen, and hydrogen, which is necessary for many spectral studies. Vacuum pumps are used to extract oxygen from the working chamber. Two-stage rotary vane equipment operates efficiently. There are several types of emission spectrometers, some of which perform non-destructive analysis. An erosion center with a depth of several microns that forms on the surface of the sample does not interfere with the subsequent operation of the object. In other situations, the sample must be pre-prepared, which requires special devices.
Determination of impurity content
Of great importance in the field of metallurgy is the factor of compliance with standards for the concentration of chemical elements that are not included in the main composition of the product. Disturbing them requires costly additional cleaning associated with remelting. For example, in the field of production of industrial products from precious metals, the cost of refining can be comparable to the price of the original material.
As a conclusion, it is important to note that spectral analysis in metallurgy should be carried out in accredited laboratories using duly certified methods using measuring instruments, the types of which are approved by the Federal Agency for Technical Regulation and Metrology.
X-ray fluorescence spectrometer
Analysis of the chemical composition of a metal can be carried out using X-rays. After excitation by primary X-rays, the characteristic radiation of chemical elements forms a spectrum. Measuring the intensity of the fluorescent lines provides concentration information. There are stationary and mobile spectrometers that carry out express measurements of a sample without destroying the material. Using devices with an X-ray fluorescence-centered principle of operation, spectral analysis of steels, other alloys, composites, and complex substances is performed. Using this method, you can find out the concentration of 45 chemical elements. Small atoms with atomic numbers up to 11 fluoresce weakly after excitation, which interferes with their identification. These elements can be identified chemically or other physical methods. XRF is not recommended for the analysis of ferrous metals; the method is convenient for sorting scrap, taking into account the limited identification of light elements. All results are visualized on a color display and saved in a file on the instrument computer. To expand the range of capabilities of portable X-ray fluorescence spectrometers, additional calibrations are installed on them. The service can be performed at the manufacturer for a small price or at service centers located in Moscow and other large cities.
Principle of the method
To carry out the study, the substance must be evaporated, since the light emitted by a substance in the gaseous state is determined by the chemical composition of that substance, unlike the light emitted by solids or liquids. To evaporate and excite substances, high-temperature flames and various types of electrical discharges in gases are used: arc, spark, etc.
High temperatures in discharges (thousands and tens of thousands of degrees) lead to the disintegration of the molecules of most substances into atoms. Therefore, emission methods are used, as a rule, for atomic analysis and very rarely for molecular analysis. The radiation of substance vapors consists of the radiation of atoms of all elements. To study it is necessary to isolate the radiation of each element.
Applying a check
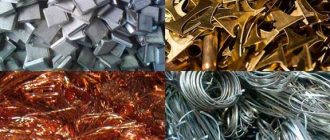
Spectral analysis of precious metals helps in sorting different types of scrap for recycling. Also, this testing method helps determine the penetration; with the help of it, when casting metal, finished products undergo certified tests. In industrial production, a spectrometer is necessary to confirm the quality of the metal that arrives at the plant.
Depending on the volume of material being tested and the purpose, there are different types of devices for spectral analysis. Portable devices are widely used in metal purchasing points. They are portable in size and light in weight, with high performance and inspection accuracy.
Sell chips
There are companies in the capital that accept old electronic goods, catalysts, scrap gold, gold-plated products and radio components.
Muscovites pass the latter most often. Moreover, you can sell radio components in Moscow at an attractive price. ◄ Back to news
Precious metals analysis
In order to determine the composition of the material, elemental analysis is used. A special device for research affects the metal with electromagnetic waves. The spectrometer detector reflects the remaining energy in the form of elementary particles, the value of which is strictly responsible for a specific chemical element. The indicator is converted into a voltage pulse, the device takes readings that are reflected on the screen in the form of a digital symbol or graph.
This research method was discovered in the 20th century, and the device for carrying out such an analysis was invented only 70 years ago. Currently, spectrometers are widely used in various industries. The use of the device in jewelry research, metallurgical testing, and chemical work is relevant. Using the device, you can determine the presence of heavy metal in soil, water, and food. It is used in their activities by ecologists and geologists. The spectrometer is used to take and test samples from other planets. This method has become so popular due to the high accuracy of analysis and speed of verification.
Equipment used
We use high-tech analyzers:
PMI-Master UVR PRO with the ability to determine carbon "Oxford Instruments Analytical Gmbh" (Germany)
Mobile spectrometer for precision analysis and sorting of metals on site and in the laboratory.
X-MET 8000
without the ability to determine carbon "Oxford Instruments Analytical Oy" (Finland)
Portable metal analyzer with the ability to determine “light elements” (Si, Mg, Al).
Benefits of working with us
On-site analysis
The ability to take measurements without cutting a sample from the finished product or workpiece.
We work all over Russia
We will come to any city in the country
High accuracy
In accordance with GOST 18895-97 “Method of photoelectric spectral analysis”
Efficiency
Possibility of departure on the day of application
State standard samples
To compare measurement results with government standards
Easy application process
Call or send a request from the website
PHOTOELECTRIC METHODS
3.1. Purpose
The methods are intended for the determination of chromium, manganese, vanadium, molybdenum, titanium in high-alloy steels of grades X18H9, X18H10T, X18N11B, X20H10M2T, X20N10M3T, etc., as well as for the determination of molybdenum, vanadium, manganese, chromium in alloyed structural steels.
3.2. Equipment, auxiliary equipment, materials
Photoelectric stylometer FES-1.
Tripod SHT-16.
Electronic generator GEU-1.
A sharpening machine, a set of files, a device or device for sharpening electrodes.
Sets of GSO ISO TsNIIChM: 9, 27, 45, 46, 94, 29, 21, 32nd and others, replacing them, as well as “secondary” production SOPs.
Permanent electrodes with a diameter of 8 mm made of electrolytic copper grade M-1 in accordance with GOST 859-78.
3.3. Preparing for analysis
Alloy structural steels are sharpened on a grinding machine, from the end surface of the standard and sample. Using an emery stone, a 1 mm layer is removed, then sharpening is done with a file. High alloy steels are sharpened with a file. The quality of surface treatment must be at least Rz20. Copper electrodes are sharpened according to the form described in paragraph 2.1.3. The light source is focused onto the slit of the FES-1 photoelectric stylometer using a raster condenser. The source is connected to the optical axis and the raster condenser is installed according to the device description.
3.4. Spectrum excitation source
An electronically controlled alternating current arc (GEU-1 generator) at various currents is used as a source of excitation of the spectrum, the ignition phase is 90 degrees, the analytical gap is 1.5 mm.
3.5. Carrying out analysis
The analysis is carried out using the “three standards” method.
The sharpened standards, samples, electrodes are placed in a ShT-16 stand, an analytical gap of 1.5 mm is set as described in the FES-1 operating manual, the arc is turned on and exposure is performed with preliminary firing for 10 s. Undecomposed light is used as a comparison line. Accumulation and measurement conditions, as well as other analysis conditions are given (in table).
3.6. Construction of a calibration graph
The graph is plotted in coordinates n
, lgC
where n
— indication of the moving scale of the potentiometer;
logC is the logarithm of concentration.
The concentration of elements in the sample is determined using a calibration curve.
3.7. Reproducibility error
Table 9
| Defined element | Content, % | Arc magnitude, A | Entrance slit width, µm | Exit slit width, µm | Filter number | Accumulation and measurement conditions | Undecomposed light signal level | Analytical lines, nm |
| Titanium in stainless steels | From 0.2 to 1.0 | 3,5 | 20 | 70 | 3 | 10:1 1:1 | 5 | 499,9 |
| Niobium in stainless steels | From 0.3 to 1.5 | 4,0 | 20 | 70 | 3 | 10:1 2:1 | 6 | 405,9 |
| Molybdenum in stainless steels | From 1.5 to 4.5 | 3,0 | 40 | 80 | without a filter | 20:1 1:1 | 8 | 553,3 |
| From 0.7 to 1.5 | 3,0 | 40 | 80 | ² | 50:1 1:1 | |||
| Molybdenum in structural steels | From 0.1 to 0.7 | 3,0 | 40 | 80 | ² | 100:1 1:1 | 8 | 553,3 |
| Vanadium in stainless steels | From 0.8 to 2.5 | 2,0 | 30 | 80 | 3 | 2:1 2:1 | 6 | 437,9 |
| Vanadium in structural steels | From 0.1 to 0.8 | 2,0 | 30 | 80 | 3 | 5:1 1:1 | 6 | 437,9 |
| Manganese in stainless steels | From 5 to 11 | 3,0 | 30 | 70 | 3 | 2:1 1:1 | 5 | 482,3 |
| From 0.4 to 2.0 | 4,5 | 30 | 70 | 3 | 10:1 1:1 | |||
| Manganese in medium alloy and structural steels | From 0.2 to 2.0 | 8,0 | 30 | 70 | 3 | 20:1 1:1 | 5 | 482,3 |
| Chromium in stainless steels | From 15 to 25 | 2,0 | 50 | 80 | without a filter | 20:1 2:1 | 6 | 534,5 534,8 |
| Chromium in medium alloy structural steels | From 0.3 to 15 | 3,0 | 30 | 80 | without a filter | 20:1 1:1 | 6 | 520,8 |
The square error of reproducibility, depending on the determined concentration and element, ranges from 1.5 to 2.5%.
SAFETY RULES WHEN WORKING IN THE SPECTRAL LABORATORY
4.1. General provisions:
a spectroscopist laboratory assistant who has started work for the first time can begin work only after receiving safety instructions from the head of the spectral laboratory, directly at the workplace;
after ten days of duplication of work (with an experienced spectroscopist), repeated instruction is carried out;
a qualification commission is allowed to work independently after testing their knowledge;
repeated instruction is carried out at least twice a year;
The briefing and permission to work independently are each time entered into the control log with the signatures of the manager. laboratory and received instruction;
The laboratory spectroscopist must know both the general and the TB rules provided for in the instructions. Failure to comply with the rules entails administrative penalties, and in more severe cases, prosecution.
4.2. Safety rules when preparing excitation sources for work:
a generator (spark) voltage of about 15,000 V is dangerous to human life; it is strictly forbidden to turn on a generator that has not been tested and inspected by the shift supervisor;
Before turning on the generator, you must check the correctness of the connection circuit, which should only be done when disconnecting it from the network. Inspection of devices should be carried out only when the generator network is disconnected;
The generator is considered ready for operation when the following are checked:
serviceability of the wires of the primary and secondary circuits,
the presence of grounding of its body,
serviceability of the switch located on the generator control panel,
correct electrode connection,
grounding the rail of the optical device; if at least one of these points is not fulfilled, it is prohibited to turn on the generator;
Damage to the primary or secondary circuit of the generator is repaired by an electrician on duty;
Grounding wires should be connected only to main grounding bars.
4.3. Rules for safe work practices:
when operating the generator, you should stand on a rubber dielectric mat;
Do not touch the electrodes when turning on the generator;
handle hot electrodes only with tweezers;
when using open-type tripods, photograph the spectrum only with safety glasses;
if there is no exhaust ventilation in the room, working with the excitation source is prohibited;
you can fix the generator only by disconnecting it from the network;
when working on a generator with a condensed spark, there must be at least two people in the room, including the worker;
Photometry should be carried out in a darkened room, alternating with photography;
all sample preparation operations associated with the release of gases should be carried out under hood;
When leaving the premises, it is necessary to turn off the general switch and lock the door of the premises.
4.4. Safety rules when sharpening electrodes and samples:
You can start sharpening electrodes only after receiving instructions;
the emery stone should only be in a protective casing;
the sanding machine must be grounded;
It is prohibited to work on a vibrating sanding wheel;
the gap between the tool rest and the circle should not exceed 2 - 3 mm;
when working, you need to stand to the side, and not against the sanding wheel;
You should wear safety glasses when working on an emery wheel;
small sharpened samples must be held in a hand vice or special clamps;
The sanding machine should be well lit.
ALL-UNION RESEARCH AND DESIGN INSTITUTE OF CHEMICAL AND PETROLEUM EQUIPMENT TECHNOLOGY (VNIIPTkhimnefteapparatura)
| Director | V.A. Samoilov |
| Deputy Director | A.G. Lamzin |
| Head of Standardization Department | Yu.A. Hook |
| Head of Department No. 29 | A.P. Okenko |
| Head of Laboratory | V.V. Raevskaya |
| Senior Researcher | Yu.K. Maksimets |
AGREED:
All-Union Research and Design Institute of Petroleum Engineering (VNIIneftemash)
| Director | N.P. Umanchik |
Ministry of Chemical and Petroleum Engineering
Technical management
| Chief technologist | E.A. Afanasenko |
| Head of Standardization Department | Yu.O. Mukhin |
Special design and technological bureau of chemical and petroleum engineering (SKTBKhimmash)
| Deputy Head for Research | V.A. Tsepkov |
| Head of Department 20 | A.S. Sibiryakov |