Calculation of the share of income
You are here: Home › Calculation of the share of income
Share weight in any area is usually considered as a relationship between the particular and the whole. Accounting is no exception. Here the share of income and expenses is calculated. Each of these operations has its own specifics and features. Neglect of the recommended rules inevitably leads to calculation errors. Their consequences can vary, from tax penalties to more serious sanctions against the taxpayer.
Calculation method
The answer to the question of how to find the share in the economy depends on what specific area needs to be considered. In any case, this is the ratio of a particular indicator to a general one. For example, the share of value added tax revenues in total tax revenues is calculated as the ratio of business entities to the total amount of revenues from all taxes. The share of tax revenues in the revenue part of the federal budget of the Russian Federation is calculated in a similar way, only tax revenues are taken directly as a private indicator, and the total amount of budget revenues for a specific period (for example, a year) is taken as a general indicator.
Calculation of the share of income: economic formula
In the economic field, specific gravity illustrates the value and significance of an object. The latter can be not only income, expense, but also profit, salary, tax. Calculations are carried out using the same formula.
Calculation of the specific weight of income involves dividing the amount of a separate column by the “total” indicator and multiplying by 100. A separate column corresponds to the indicator for which the specific weight is determined. In our case, this can be any of the income received by the business structure during the reporting period (income from core activities, investments, etc.).
The specific gravity is calculated taking into account derivatives and relative indicators. The latter are the intensity of development, implementation of the plan, etc. In fact, everything depends on the goal. Specific gravity is important for analyzing indicators and monitoring their dynamics. Using the above formula, you can calculate the share of certain categories of income in different periods for subsequent comparison of data.
Features of calculating specific gravity
Specific gravity is a relative indicator. It is displayed as a percentage. It is also possible to display it in fractions. The unit of measurement is determined by the very formulation of the concept.
As for the calculations themselves, everything depends on the accuracy of the input data. Accounting errors lead to distorted results. The relative indicator may be lower or higher than the real one. Both call into question the accuracy of analytics based on the data obtained.
Who will calculate the specific gravity?
Calculating the share of income is a task for a professional accountant. Before substituting values into the formula, it would be a good idea to check the accounting status and the reliability of the data. Detected errors must be taken into account in calculations. Correcting indicators minimizes the risk of obtaining overestimated or underestimated results.
Is your accounting department overloaded with current work? Are you working with a private freelancer who cannot guarantee the accuracy of the calculations? Transfer the function to external control. Specialists from a specialized outsourcing company will perform the necessary calculation operations with a preliminary check of the accuracy of the input data. The cost of servicing the customer company will depend on the volume, complexity of the work, and the inclusion of additional options.
Calculation of the share of income is carried out promptly. The resulting indicator can be used to assess the effectiveness of the economic activities of a business entity. But we do not recommend using it as the only criterion. Specific gravity, like other relative indicators, is characterized by some limitations. Accordingly, it is rational to consider it in conjunction with other relevant economic parameters. In this case, the analysis of the subject’s activities, income dynamics and operational efficiency will be competent, complete, and as informative as possible.
The share of the area of the main (or auxiliary) workshops d" is determined by the ratio of the area occupied by the main (or auxiliary) shops, Pi, to the entire industrial production area of the enterprise P and is expressed as a percentage, i.e. [p.96]
The share of the area of the main (or auxiliary) workshops du is determined by the ratio of the area occupied by the main (auxiliary) workshops Su to the entire industrial production area of the enterprise, association S (in %) [p.132]
Share of area of main (or auxiliary) workshops 132 [p.331]
It is also extremely useful for studying the rationality of the structure of an enterprise’s areas to calculate the proportion of areas of the main (or auxiliary [p.235]
The share of the main oilseed crop in the Orenburg region - sunflower - in the crops of industrial crops is 96.5%. In terms of the size of the sown area and the gross harvest of sunflower seeds, the Orenburg region ranks first in the Ural region. [p.134]
Specific annual costs for floor cleaning, per 1 m2 of floor, depend on the purpose of the room, its expanded area, the number of shifts of the enterprise and other factors. The costs of wiping glass and skylights mainly depend on the characteristics of the production environment - the intensity of smoke and dust emission, the height of the room, the number of glasses in filled light openings, the number of shifts at the enterprise, etc. [p.187]
To determine the differences in the productivity of new and replaced machines, equipment, instruments and other means of labor, coefficients are used, calculated by the ratio of the annual volumes of work performed when using new and replaced means of labor. In a similar way, coefficients are determined to take into account changes in the quality parameters of buildings (structures) that differ in production capacity, throughput, usable area, etc. The economic efficiency of new building materials is assessed by the ratio of the specific consumption of the base and new material per unit of structural element or type of work. The efficiency of the fixed assets used is also calculated. [p.162]
For example, when using the specific indicators method, the costs for the main functions of the LSI are calculated as the sum of the costs for obtaining the corresponding active area of the wafer based on the specific costs for obtaining a unit of area using the basic technology. Knowing the functional structure of the product, the type of technology, the area of the plate per each function and the unit costs per unit area, you can determine the cost of the product variant. [p.93]
Since in trade a significant share in the total cost of fixed assets is occupied by rental retail space and other types of fixed assets, it should be stipulated that the capital productivity should be calculated on all fixed assets, including leased ones. [p.347]
The main principle of organizing the transport facilities of a power engineering plant is its compliance (adequacy) with the nature of the products produced, the scale of production, and the movement of the production process. Indicators of this compliance are the absence of any unnecessary transportation of goods, the size of the production area occupied by transport awaiting loading of materials and parts at different stages of production, the speed of transfer of workpieces and parts from one workplace to another, the best use of all available lifting and transport vehicles, reliability and safety of goods during transportation; minimum share of all in-plant costs for lifting and transport operations in the cost of a unit of production. [p.175]
According to the proposed method, reducing the estimated cost of construction of facilities as a result of applying the most effective design solutions will be reflected in improving the quality indicators of production and economic activities of construction organizations and the ministry as a whole, such as increased labor productivity, profit, and reasonable expenditure of the wage fund. Therefore, construction organizations will be interested in constructing facilities not only with less labor intensity, but also at an estimated cost, in the use of cheap and lightweight structures on a large scale as a result of the introduction of advances in science, technology, advanced experience and inventions. An increase in the share of reconstruction of fixed assets of the national economy in the total volume of construction and installation work of the organization and the ministry, an increase in the quality of construction, despite the additional specific labor costs per unit of production capacity (useful area, cubic capacity) of objects, will not affect the decrease in the quality indicators of construction organizations. [p.167]
For workshops equipped with a large amount of equipment on which the main operations of the technological process of manufacturing products are carried out (for example, mechanical, pressing, forging, mechanized foundries), such a base is the production equipment of these departments. If the share of equipment in the fixed assets of workshops is insignificant and the production capabilities of these workshops are determined mainly by the size of the areas (for example, in many assembly, welding, non-mechanized foundries), then their production areas serve as the base. [p.42]
This indicator characterizes the degree of utilization of the enterprise's capacity by area, the share of which in fixed assets ranks first or second. [p.59]
An independent section of the comparative analysis is the comparison of the organization of auxiliary production. The following indicators can be applied: the share of auxiliary production in terms of the cost of fixed assets, the occupied production area, the degree of centralization of supply, defined as the ratio of the receipt of tools, containers, etc. from specialized enterprises to the total need, the ratio of main and auxiliary workers for the plant as a whole and for individual production, processing and workshops, the structure of auxiliary workers, including workers engaged in predominantly low-skilled manual labor, the utilization rate of production space and equipment in auxiliary workshops and areas. [p.183]
Preparation of a geological exploration project includes two main stages: 1) collection and analysis of the necessary data 2) development of a model for prospecting and exploration work. A block diagram of such a model is shown in Fig. 58. A set of possible strategies is input to the model. Strategies that can be considered include expanding the scope of work to cover new territories, intensifying drilling within known areas, increasing the proportion of detailed geological and geophysical studies and reducing the cost of exploratory drilling, redistributing capital investments between prospecting and exploration drilling, etc. [p.175]
The main control indicators are labor intensity per 100 rubles. output area per worker cost of 1 m2 of developed area (specific capital costs, including the cost of equipment) ratio of the number of auxiliary workers to production workers ratio of the number of engineers, office workers, MOP and security to the number of workers. [p.264]
The weight of the deck, for example, in an overhead crane reaches 2 tons, which is about 8% of the total weight of the crane. Three main ways to reduce the weight of the deck can be identified: reducing the area of the galleries, reducing the thickness of the deck, and using materials with a lower specific gravity. 158 — [p.158]
Analysis of the organizational and technical level of production. Due to the complexity of organizing production, this type of analysis in mechanical repair shops is important. When analyzing the organizational level, in particular, the following main issues are studied: the organizational and production structure of mechanical repair shops, the level of specialization of sections, teams and jobs, the proportion of advanced methods for organizing repair and maintenance, the amount of equipment serviced by one worker. The level of organization of labor and production in repair shops can also be judged indirectly through indicators characterizing the duration of downtime of production equipment for repairs, the quality of service and repair, the level of use of equipment of the repair departments of the workshop and their production areas, the share of engineering and technical personnel in the total number of workers in the repair and mechanical department. workshops, labor intensity and cost of maintenance and repair, etc. [p.238]
Despite significant increases in prices for materials, equipment and labor in the United States over the past few years, electricity prices have either remained the same or even decreased. The report shows that this is happening due to significant improvements in the electricity generation process. The need to further improve the cycle was the main incentive for the design and construction of a new supercritical pressure thermal power plant. In this installation, steam from a once-through boiler with a pressure of 317 atm and a temperature of 622 ° C is supplied to a turbine with a capacity of 125 Meters, which has a double intermediate superheat of the steam. The report describes the turbine and individual elements of auxiliary equipment. The report also discusses the specific features that distinguish the design and operation of this plant from conventional power plants. The calculated specific heat consumption of this installation is 2150 kcal/kWh. The dimensions of this turbine with a capacity of 125,000 kW are such that the turbine unit is installed in the area occupied by a turbine with a capacity of 40,000 kW installed 30 years ago. [p.41]
Additional, or private, indicators include specific labor intensity, the share of construction and installation work in the total volume of capital investments, prefabrication ratio, consumption of basic building materials (timber, cement, metal) per 1 million rubles. estimated cost of construction and installation work, development coefficient, length of utilities and roads, volume of earthworks for vertical planning, utilities and road construction, costs of site development (demolition of buildings, deforestation, drainage, etc.), weight of buildings being erected, the degree of useful use of the volume and area of buildings, the labor intensity of manufacturing products at an enterprise under construction, in-plant transport costs, ex-[p.137] costs
The average number of employees, including industrial and production personnel, including primary and auxiliary workers, and the number of management personnel are given. The number of workers engaged in manual and mechanized labor, workers engaged in monitoring machines, the staff turnover rate, the level and dynamics of labor productivity, losses of working time, their causes, the average percentage of production standards fulfilled by piece workers, the proportion of workers according to technically sound standards are also indicated. wage fund, average monthly wage, its growth, provision of enterprise employees with living space and preschool children's institutions, the size of material incentive funds and the fund for social and cultural events and housing construction per employee. [p.15]
A significant portion of capital investments in the oil and gas industry is associated with drilling wells. The volume of work on their construction annually amounts to billions of rubles in the USSR. This is associated with the high share of capital intensity and capital intensity of the industries studied. It is predetermined by modern production technology, the characteristics of the reproduction and investment processes, the structure and ratio of fixed and working capital necessary for oil and gas production. The oil and gas industry requires the construction of a large number of wells at fields being put into development, in the future to maintain production levels, its growth and compensation for the natural decline in the productivity of the existing well stock. Drilling new areas, involving oil and gas resources in remote and hard-to-reach areas of the country, as well as fields with relatively small reserves or deeper occurrence of raw materials leads to an increase in capital intensity. [p.170]
With the complete destruction of the buildings of the Northern Century. is paid in the amount of the full insured amount, but not higher than its maximum level established for this group of policyholders. For cooperatives (except for collective farms) and public organizations, this limit is the replacement cost, and for collective farms and citizens - the actual value. cost of buildings (with a discount for wear and tear). In case of partial damage to buildings, the amount of damage to be compensated is determined a) using unit prices used in the assessment of buildings and calculated per unit area or cubic capacity of individual parts of the Structure, taking into account the total cost of the structure and the specific weight of the affected structural elements b) by drawing up technical specifications. estimates for the restoration of the structure or repair of its individual parts. In the latter case, the cost of restoring the damaged parts is accepted as a loss to the policyholder. The cost of the remains of damaged parts of the structure (logs, boards, bricks, iron) is excluded from the total amount of loss. The same methods for determining S. century. They are mainly used for damage to machinery, equipment and inventory. In the event of the loss of goods and materials belonging to cooperative and public organizations, S. v. calculated according to accounting data. The amount of damage to household property is determined based on its actual value. value on the day of death at state retail prices with a discount for wear and tear and taking into account the depreciation of individual items. [p.392]
SAVINGS in national economy - saving labor, material and financial resources as a result of their more rational use. It is expressed in a reduction in costs per unit of manufactured and sold products, services provided and work performed, in a reduction in the costs of maintaining government bodies. E.'s size serves as an important economic indicator. efficiency of capital investments, scientific and technical. progress in folk art. The value of energy is determined using a system of natural, labor, and cost indicators. Natural indicators are used to identify a decrease in specific costs of raw materials, materials, fuel per unit of production, unit of power or to calculate the increase in finished products obtained from a unit of raw materials, area, equipment power (in metallurgy, industry, for example, removal of cast iron from 1 m3 of useful volume of a blast furnace). The main labor indicator of electronics is the reduction in the labor intensity of products (services, work), measured by the number of man-hours or man-days spent on its production. Efficiency of social labor is also achieved by improving the management apparatus, planning, accounting, management and cultural development in the country. The indicator of efficiency here is a decrease in the number of employed workers, which, while improving the quality of the apparatus, characterizes efficiency in the use of labor resources. Cost (monetary) indicators allow a) summing up energy, expressed in natural and labor indicators, b) calculating energy not only for a certain type of product or cost, but also for the entire site, workshop, enterprise, construction site, industry, district , the Economic Council and the national economy in general, c) identify E. both from all activities and from individual types of them, aimed, in particular, at modernizing equipment, using new, more advanced machines and equipment, and introducing new technology , improving product quality (increasing performance properties, durability and
For a more complete feasibility study when comparing design solutions, additional indicators are used: labor productivity for net products, use of production space and fixed production assets, specific costs of raw materials and fuel and energy resources per unit of final product of the enterprise, etc. [p.84 ]
Use of production area 1) quantity of products per 1 m2 of area or 1 mg of building 2) Cost of products (commodity) per 1 m2 of area or per 1 m3 of production premises. …. Specific consumption rates: 1) raw materials and basic materials 2) natural technological fuel. ….. [p.177]
The restoration process in the first post-war five-year plan was primarily distinguished by its scale. Previously, the amount of damage caused to our national economy by the Nazi invaders has already been cited. Before the Great Patriotic War, over 40% of the total population of the Soviet Union lived on the territory of the temporarily enemy-occupied regions of the country, a third of all industrial products were produced, about half of the railway network (by length), 47% of the crop area, and about half of the livestock were concentrated. The share of these areas in coal mining and iron smelting was especially high. As a result of the Nazi occupation, a large share of the country's fixed assets was thus destroyed. This also determined the features of the process of restoration of the national economy of the USSR after the Second World War. [p.483]
The share of construction and installation work is highest in the latter groups of enterprises, where the increase in fixed assets over 13 years exceeds 350% (Table 17). Obviously, at these enterprises, funds are predominantly directed to the passive, rather than to the active part of fixed assets. This dependence of the growth rate of means of labor and the nature of the use of capital investments completely coincides with the dependence of the growth rate and the nature of renewal of fixed assets of enterprises, calculated using indicators of the built-up area and the fleet of metal-cutting machines. [p.61]
The area is determined on the basis of the layout of the departments and premises of the workshop, as well as the layout of equipment and workplaces, taking into account the technological design standards of auxiliary workshops. They also use an enlarged method based on specific area per unit of main equipment (36-46 m2). [p.185]
Some organizations that participated in the VNIIST experiment in 1975 constructed facilities with a higher unit cost per unit of production capacity or usable area compared to the design solutions for the same facilities and design solutions implemented in the previous five-year plan. The audit showed that a one-time increase in the estimated cost of these design solutions provides a national economic effect in the future due to a reduction in capital repairs, early profits in the operation of fixed assets, etc. At the same time, the increased material intensity of the construction of such facilities increased the cost output when compared with Based on the base output of 1970, organizations received an unreasonably high rate of growth in labor productivity. [p.140]
Reconstruction and technical re-equipment of existing enterprises will have a great impact on capital productivity. When carrying out their reconstruction, a significant part of capital investments, as a rule, is directed towards a radical renewal of tools, increasing production space, improving traditional and introducing new technological processes. The share of capital investments allocated for these purposes in mechanical engineering and metalworking is very significant, as evidenced by data for 1966-1972 1960 - 77% 1970 - 63% 1971 - 66% 1972 - 69%. As a result of the long-term preservation of such ratios in the reproductive structure of capital investments, the functional structure of production fixed assets has changed (Table 7). The emerging progressive trends in changing the structure of production fixed assets (a slight increase in the share of the active part of the assets - power and working machines, measuring instruments, vehicles) contribute to an increase in capital productivity. [p.145]
This interpretation of capacities ensures their commensurability, since the structure of capacities is taken into account in a differentiated manner, and sets of specific labor costs in a single structure with resources act as a unit of measurement of power consumption for production. For mechanical processing and procurement operations, where the power-determining element of the complex is equipment, resource reserves will be represented by the operating time fund of this equipment in machine hours for assembly and welding operations, where the main one, as a rule, is an equipped and specialized assembly area - time fund work on it in square-meter-hours. An estimate of the technological costs for producing a unit of production in an assembly will be the required amount of space occupied in a certain period of time. [p.183]
For a more in-depth analysis of the use of the potential capabilities of various types of equipment, specific productivity indicators are calculated as the ratio of the volume of production (work) produced per unit of time to the main operational characteristics of a given machine, unit, apparatus (i.e. per unit of power, productivity, load capacity, furnace volume , hearth area, etc.). For example, the amount of ore is determined per 1 m3 of excavator bucket capacity, the volume of transported cargo is determined per 1 ton of machine lifting capacity, steel production per day is determined per 1 m2 of furnace bottom, etc. [p.93]
SPECIFIC CAPITAL INVESTMENTS—the amount of capital investments per unit of commissioned production capacity or unit of annual production growth. They serve as one of the main indicators of the economic efficiency of capital investments (see) are used when planning investments in the creation of fixed assets in industry, transport, communications, villages. farms, housing, cultural and community facilities and in the development of projects for enterprises, buildings, and structures. For example, U.K.V. calculated for 1 ton of oil production, 1 m3 of prefabricated reinforced concrete, 1 m2 of living space, 1 student. place in schools, etc. Reducing construction time, reducing the cost of construction, introducing advanced technologies. processes and high-performance equipment, mechanization and automation of production, [p.436]
Gas purification and regeneration-recovery installations and structures occupy much less production area; they are more closely connected with the main production than water treatment plants. Therefore, the costs for them are planned, normalized and taken into account as part of the production costs of those divisions of the main production that they serve. At the same time, the costs of gas cleaning installations, which often provide recirculation of waste gases, cannot always be isolated in the planned, normative and actual costs of a particular department due to the high labor intensity of analytical calculations and the small share of these costs in the cost of products of the main production.. Often this is also caused by the combination of basic technological, gas cleaning and transport operations. [p.197]
In a number of areas, tobacco, vegetable crops, vineyards and orchards occupy a significant share of the farm economy. The main areas of tobacco, orchards and vineyards are located in the southern subzone, mainly in the Crimean, Kherson and Odessa regions. [p.111]
How to calculate specific gravity as a percentage
- How to calculate specific gravity as a percentage
- How to calculate share of sales
- How to calculate the specific gravity of products
Formula and algorithm for calculating specific gravity as a percentage
There is a set (whole), which includes several components (component parts).
Let us introduce the following notation:
X1, X2, X3, . Xn are parts of the whole.
They can be expressed in various units of measurement - rubles, pieces, kilograms, etc.
To find the specific gravity of each part of the population (Wi), you need to use the following formula:
That is, the value of each part is divided by the total amount and multiplied by 100 percent.
Specific weight will indicate the value, importance or influence of each element in the aggregate.
To check the correctness of the calculations, you need to add all the specific weights together - their sum should be equal to 100 percent.
Example of calculating specific gravity as a percentage
The company produced 100,000 notebooks during the reporting period.
- notebooks 12 sheets - 30,000 pieces.
- notebooks 18 sheets - 10,000 pieces.
- notebooks 24 sheets - 10,000 pieces.
- notebooks 48 sheets - 30,000 pieces.
- notebooks 96 sheets - 20,000 pieces.
It is required to find the specific gravity of each type of product.
To solve this problem, we will use the formula given above.
1) W1 (notebooks 12 sheets) = (30000 / 100000) * 100% = 0.3 * 100% = 30%.
2) W1 (notebooks 18 sheets) = (10000 / 100000) * 100% = 0.1 * 100% = 10%.
3) W1 (notebooks 24 sheets) = (10000 / 100000) * 100% = 0.1 * 100% = 10%.
4) W1 (notebooks 48 sheets) = (30000 / 100000) * 100% = 0.3 * 100% = 30%.
5) W1 (notebooks 96 sheets) = (20000 / 100000) * 100% = 0.2 * 100% = 20%.
Let's sum up the obtained specific gravities:
How to calculate the specific gravity or structure of a phenomenon?
Specific gravity and its calculation is one of the most frequently used indicators. Its calculation is used in statistics, organizational economics, financial business analysis, economic analysis, sociology and many other disciplines. In addition, the specific gravity indicator is used when writing analytical chapters of coursework and dissertations.
Initially, specific gravity is one of the methods of statistical analysis, or rather, even one of the varieties of relative values.
The relative size of the structure is the specific gravity. Sometimes the specific gravity is called the share of the phenomenon, i.e. This is the proportion of an element in the total volume of the population. The calculation of the share of an element or specific gravity (as you like) is most often carried out as a percentage.
// Formula for calculating specific gravity
The formula itself can be presented in different interpretations, but its meaning is the same and the principle of calculation is the same.
Two important rules:
— The structure of the phenomenon should always be equal to 100%, no more, no less, if adding the fractions of 100 does not work out, then do additional rounding, and the calculations themselves are best done with hundredths.
- The structure of what you are calculating is not so important - the structure of assets, the share of income or expenses, the share of personnel by age, gender, length of service, education, the share of products, the structure of the population, the share of costs in the cost - the meaning of the calculation will be the same, divide the part by the total, multiply by 100 and get the specific gravity. Don’t be afraid of different words in the text of the problem, the calculation principle is always the same.
Example of specific gravity calculation
Simple structure
– calculate the personnel structure by age using the following data.
We check the sum of the shares ∑d = 15.56+32.22+45.56+6.67 = 100.01%, with this calculation there is a deviation from 100%, which means it is necessary to remove 0.01%. If we remove it from the 50 and older group, the adjusted share of this group will be 6.66%.
We enter the obtained data into the final calculation table
All direct problems for determining specific gravity have this calculation principle.
Complex structure -
There are situations when the source data presents a complex structure and several groupings are made within the phenomenon. The object is divided into groups, and each group, in turn, is not yet a subgroup.
In such a situation, there are two ways to calculate:
– either we calculate all groups and subgroups according to a simple scheme, divide each number by the final data;
- either we count groups from the general given, and subgroups from the value of the given group.
Calculate the population structure using the following data:
We use a simple structure calculation. We divide each group and subgroup by the total population. Using this method of calculation, we find out the share of each group and subgroup in the total population. When checking, you will only need to add up the groups - in this example, the urban and rural population in the total number, otherwise if you add up all the data, the sum of the shares will be 200%, and a double count will appear.
We enter the calculation data into the table
Let's calculate the share of each group in the total population and the share of each subgroup in the group. The share of urban and rural population in the total population will remain the same as in the calculation above 65.33% and 34.67%.
But the calculation of the shares of men and women will change. Now we will need to calculate the proportion of men and women in relation to the size of the urban population or rural population.
Subscribe to RSS and you will receive information about site updates to your RSS channel!
Author: gidroadmin
Date of: 2008-12-08
A liquid is a continuous medium that has the property of fluidity, that is, it is capable of unlimitedly changing its shape under the influence of arbitrarily small forces, but unlike a gas, its density changes little when pressure changes.
In aeromechanics, the term “droplet liquid” is used to emphasize the difference between a liquid and a gas; the gas in these cases is called a “compressible liquid”.
Liquids can be ideal or real. Ideal - non-viscous liquids with absolute mobility, i.e. absence of frictional forces and tangential stresses and absolute immutability, and volume under the influence of external forces. Real - viscous liquids that have compressibility, resistance, tensile and shear forces and sufficient mobility, i.e. the presence of frictional forces and tangential stresses.
Real fluids can be Newtonian and non-Newtonian (Bingham). In Newtonian fluids, when one layer of fluid moves relative to another, the magnitude of the shear stress is proportional to the shear rate. At relative rest, these stresses are zero. This pattern was established by Newton in 1686, which is why these liquids (water, oil, gasoline, kerosene, glycerin, etc.) are called Newtonian liquids. Non-Newtonian fluids do not have great mobility and differ from Newtonian fluids by the presence of tangential stresses (internal friction) at rest.
Basic properties of liquids: density, specific gravity, viscosity, compressibility , etc.
Density ρ – mass of liquid per unit volume. For a homogeneous liquid
where m is the mass of liquid in volume V. The units of measurement of ρ in the CGS system are g/cm 3 , in the MKGSS system they are kgf s 2 /m 4 , and in the SI system they are kg/m 3 .
Specific gravity γ – weight of liquid per unit volume:
where G is the weight of the liquid. The units of measurement of γ in the CGS system are dyn/cm 3 , in the MKGSS system – kgf/m 3 , and in the SI system – N/m 3 .
Specific gravity and density are related by the dependence γ=ρ·g, where g is the acceleration of gravity.
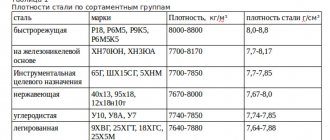
Density and specific gravity of some technical fluids.
| Liquid | t, 0 C | ρ, kg/m 3 ; γ, kgf/m 3 | γ, N/m 3 | ρ, kgc s 2 /m 4 |
| Autol 10 | 20 | 920 | 9025 | 93,8 |
| Alcohol (anhydrous) | 20 | 795 | 7799 | 81,0 |
| Ammonia | -34 | 684 | 6710 | 69,7 |
| Aniline | 15 | 1004 | 9849 | 102 |
| Acetone | 15 | 790 | 7750 | 80,5 |
| Petrol | 15 | 680 – 740 | 6671 – 7259 | 69,3 – 75,4 |
| Bitumen | – | 930 – 950 | 9123 – 9320 | 94,8 – 96,8 |
| Distilled water | 4 | 1000 | 9810 | 102 |
| Sea water | 4 | 1020-1030 | 10006-10104 | 104-105 |
| Glycyrin (anhydrous) | 15 | 1270 | 11772 | 129 |
| Tar | 15 | 930-950 | 9123-9320 | 94,8-96,8 |
| Coal tar | 15 | 1200 | 12459 | 122 |
| Kerosene | 15 | 790 – 820 | 7750-8044 | 80,5 – 93,5 |
| Fuel oil | 15 | 890 – 940 | 8731 – 9221 | 90,7 – 95,8 |
| Oil: | ||||
| -vaseline | 20 | 860 – 890 | 8437 – 8731 | 87,7 – 90,7 |
| -industrial 12 | 20 | 876 – 891 | 8594 – 8741 | 89,3 – 90,8 |
| -industrial 20 | 20 | 881 – 901 | 8643 – 8839 | 89,8 – 93,3 |
| -industrial 30 | 20 | 886 – 916 | 8692 – 8986 | 90,3 – 93,4 |
| -industrial 45 and 50 | 20 | 890 – 930 | 8731 – 9123 | 90,7 – 94,8 |
| -industrial 45 and 50 | 20 | 890 – 930 | 8731 – 9123 | 90,7 – 94,8 |
| -castor | 20 | 960 | 9418 | 97,8 |
| -machine | 20 | 898 | 8809 | 91,5 |
| -transformer | 20 | 887 – 896 | 8701 – 8790 | 90,4 – 91,3 |
| -turbine 30 and 32 | 20 | 894 – 904 | 8770 – 8868 | 91,1 – 92,1 |
| Whole milk | 20 | 1029 | 10094 | 103 |
| Natural oil | 15 | 700 – 900 | 6867 – 8829 | 71,4 – 91,7 |
| Beer | 15 | 1040 | 10202 | 106 |
| Mercury | 20 | 13546 | 132886 | 1381 |
| Methyl alcohol | 15 | 810 | 7946 | 82,6 |
| Ethanol | 15-18 | 790 | 7750 | 80,5 |
| Molten cast iron | 17 | 1210 | 11870 | 123 |
Read also: Hammer slap leg with your own hands
Density of water and mercury at different temperatures.
Source: Vilner Ya.M. Reference manual on hydraulics, hydraulic machines and hydraulic drives.
Views: 164260
Comments on this article!!
Comment added by: mqsqt Date: 2011-09-03
Comment added by: Bashtag Date: 2012-10-29
Comment added by: Sanya Date: 2013-11-12
Comment added by: Ir Date: 2014-01-15
Comment added by: ir Date: 2014-04-28
Comment added by: lelik Date: 2014-10-20
Nice way to go
Comment added by: sens Date: 2014-10-23
Thank you very much for the table. It was very useful. ))))
Comment added by: Yuri Date: 2014-12-30
Comment added by: edld Date: 2015-01-28
Comment added by: Vitaly Date: 2018-05-14
Thank you very much for the material
Add your comment
| Similar articles! | |
| Viscosity of liquids | Viscosity of water, milk, gasoline, oil, alcohol | |
| Hydrostatic pressure. Pascal's law. | |
| Bernoulli's equation - the basic equation of hydraulics | |
| Compressibility of liquids | |
| Laminar and turbulent fluid flow regime | |
| The most popular articles on the site! | |
| Conversion of units of measurements. Pressure unit converter | |
| Viscosity of liquids | Viscosity of water, milk, gasoline, oil, alcohol | |
| Density and specific gravity of liquids | Density of water, oil, alcohol, kerosene, gasoline and petroleum | |
| Hydraulic calculation of pipelines | |
| Bernoulli's equation - the basic equation of hydraulics | |
| Laminar and turbulent fluid flow regime | |
| Hydrostatic pressure. Pascal's law. | |
| Thermal expansion of liquids | |
| Compressibility of liquids | |
| History of hydraulics. History of the development of hydraulics. Part 1. From ancient Greece to the mid-18th century. | |
Determination of specific gravity
The physical quantity, which is the ratio of the weight of a material to the volume it occupies, is called the HC of the material.
Materials science of the 21st century has gone far ahead and technologies that were considered science fiction a hundred years ago have already been mastered. This science can offer modern industry alloys that differ from each other in qualitative parameters, but also in physical and technical properties.
To determine how a certain alloy can be used for production, it is advisable to determine the HC. All objects made with the same volume, but different types of metals were used for their production, will have different masses, it is in a clear connection with volume. That is, the ratio of volume to mass is a certain constant number characteristic of this alloy.
To calculate the density of a material, a special formula is used, which has a direct connection with the HC of the material.
By the way, the HC of cast iron, the main material for creating steel alloys, can be determined by the weight of 1 cm 3, reflected in grams. The more HC the metal, the heavier the finished product will be.
Carrying out analysis
Determination of density is carried out using a urometer apparatus. Urine along the wall is placed in a special cylinder; if the process is accompanied by the appearance of foam, then it must be removed. The entire cylinder is placed in the device. It should be noted that if the patient cannot go to the toilet himself, then urine must be collected with a catheter. The density is determined by the level of the underlying meniscus of the apparatus scale; therefore, the cylinder and the apparatus should not be in contact. There are situations when the volume of urine obtained is too small, then it is diluted with distilled water and all calculations are made taking into account the degree of dilution. And so, when diagnosing using this method, qualitative and quantitative indicators are taken into account. A mixture of chloroform and benzene is placed in a cylinder, and a drop of the test liquid is dropped into it. If she drowned, then the urine density is too high, if she floated, then it is low. By adding each of the components in parts, they ensure that the material under study is in the middle of the liquids. The density of the urine will be equal to the density of the resulting solution. It is worth remembering that the urometer was calibrated at 15 C, which means that it is necessary to make an adjustment for the ambient temperature. At high temperatures, a person always drinks more and loses more fluid, and at low temperatures, he consumes very little fluid. All this, of course, influences, and daily changes in density.
Specific gravity formula
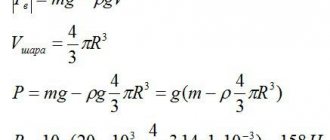
The formula for calculating HC looks like the ratio of weight to volume. To calculate hydrocarbons, it is permissible to use the calculation algorithm, which is set out in a school physics course. To do this, it is necessary to use Archimedes' law, or more precisely, the definition of the force that is buoyant. That is, a load with a certain mass and at the same time it floats on the water. In other words, it is influenced by two forces - gravity and Archimedes.
The formula for calculating the Archimedean force is as follows
F=g×V,
where g is the hydrocarbon liquid. After the substitution, the formula takes the following form: F=y×V, from here we obtain the formula for the shock load y=F/V.
Types of production costs
As a rule, for analysis, not the total costs of the enterprise are used, but individual groups of costs. The following cost groups are most often used in economic analysis:
Material costs - the cost of materials, semi-finished products and raw materials purchased externally, this also includes the cost of transportation services, customs duties;
Energy costs cost of electricity costs;
Labor costs - wages, compensation, benefits of the main production personnel of the enterprise;
Contributions for social needs;
Depreciation of fixed assets - the amount of deductions for the restoration of fixed assets;
Other expenses (for example, rent, loan payments).
Difference between weight and mass
What is the difference between weight and mass. In fact, in everyday life, it does not play any role. In fact, in the kitchen, we don't make a difference between the weight of a chicken and its mass, but there are serious differences between these terms.
This difference is clearly visible when solving problems related to the movement of bodies in interstellar space and neither those having relations with our planet, and under these conditions these terms differ significantly from each other. We can say the following, the term weight has meaning only in the zone of gravity, i.e. if a certain object is located next to a planet, star, etc. Weight can be called the force with which a body presses on the obstacle between it and the source of attraction. This force is measured in newtons. As an example, we can imagine the following picture: next to a paid education there is a stove with a certain object located on its surface. The force with which an object presses on the surface of the slab will be the weight.
Body mass is directly related to inertia. If we consider this concept in detail, we can say that mass determines the size of the gravitational field created by the body. In fact, this is one of the key characteristics of the universe. The key difference between weight and mass is this - mass does not depend on the distance between the object and the source of gravitational force.
To measure mass, many quantities are used - kilogram, pound, etc. There is an international SI system, which uses the usual kilograms, grams, etc. But besides it, many countries, for example, the British Isles, have their own system of weights and measures, where weight is measured in pounds.
Difference Between Specific Gravity and Density
UV - what is it?
Specific gravity is the ratio of the weight of matter to its volume. In the SI international system of measurements it is measured as newton per cubic meter. To solve certain problems in physics, hydrocarbons are determined as follows - how much heavier the substance being examined is than water at a temperature of 4 degrees, provided that the substance and water have equal volumes.
For the most part, this definition is used in geological and biological studies. Sometimes, the HC calculated using this method is called relative density.
Concept in physics
Specific gravity in physics is defined as the weight of a substance per unit volume. In the SI measurement system, this value is measured in N/m3. To understand how much 1 N/m3 is, it can be compared with the value of 0.102 kgf/m3.
where P is body weight in Newtons; V—body volume in cubic meters.
If we consider simple water as an example, we will notice that its density and specific gravity are almost the same and change very little with changes in pressure or temperature. Her y. V. equal to 1020 kgf/m3. The more salts are dissolved in this water, the greater the value of y. V. This figure for sea water is much greater than for fresh water, and is equal to 1150 - 1300 kgf/m3.
The scientist Archimedes once noticed a long time ago that a buoyant force acts on a body immersed in water. This force is equal to the amount of liquid that the body displaced. When a body weighs less than the volume of displaced fluid, it floats on the surface and goes to the bottom if the situation is the opposite.
Metals with the highest and lowest specific gravity
In addition to the concept of specific gravity used in mathematics and physics, there are also quite interesting facts, for example, about the specific gravities of metals from the periodic table. If we talk about non-ferrous metals, then the heaviest ones include gold and platinum.
These materials exceed in specific gravity such metals as silver, lead and many others. “Light” materials include magnesium with a weight lower than that of vanadium. We must not forget about radioactive materials, for example, the weight of uranium is 19.05 grams per cubic cm. That is, 1 cubic meter weighs 19 tons.
Deviation from normal indicators
There are two types of changes in this indicator. 1. Specific gravity exceeds the norm. An increase in the concentration of urine is a consequence of certain processes of a pathological nature.
- Increasing edema occurs, which is caused by glomerulonephritis or insufficient renal function.
- Various pathologies of hormonal origin.
- Excessive loss of fluid from the body due to burns, vomiting, diarrhea, and blood loss.
- Damage to abdominal organs and intestinal obstruction.
- Vomiting in pregnant women.
- High doses of antibiotics.
- Kidney pathologies of an acute or chronic nature.
There are many factors that increase the density of urine. These may be metabolic disorders or diseases of the reproductive and urinary apparatus. This phenomenon can also be observed with physiological changes - increased sweating and thirst after eating salt. Oddly enough, the increased specific gravity of urine has its own clear manifestations
- The volume of urine is reduced.
- Urine has a darker color.
- The smell of urine is quite unpleasant.
- The appearance of edema is noted.
- The patient begins to experience swelling.
- The patient is weak, drowsy and prone to getting tired quickly.
- Pain in the lower back and abdomen is common.
In children, increased density may occur due to the presence of pathologies that are congenital or acquired. Very often, children are affected by intestinal infections due to weak immunity, and in case of poisoning, as is known, a lot of fluid is lost. You can separately consider diabetes mellitus, in which an increase in the weight of urine is based on the high content of sugars in it. Or if there is protein and breakdown products in the urine. Urine will be denser. To identify any such pathology, certain tests must be carried out.
2. Decrease in relative density Sometimes, after any illness, the doctor recommends that the patient consume more water and other drinks to quickly remove toxins and replenish fluid balance. Such replenishment will most likely reduce the concentration of dry sediment and dilute the urine; such dilution is physiological in nature. It is also considered normal for a decrease in urine concentration in the heat, when a person drinks a lot, or when taking diuretics. There are a number of reasons that cause pathological dilution.
- Neurogenic diabetes, characterized by a decrease in the synthesis of pituitary hormones.
- Nephrogenic diabetes, which occurs when nephron cells become tolerant to antidiuretic hormone.
- Diabetes that occurs during pregnancy.
- Nervous disorders due to stress and depression.
- Inflammation of the kidney tubules.
The condition of reduced density (hyposthenuria) requires diagnostic measures, as it can have quite serious causes. For further diagnosis, it is necessary to prescribe tests that determine exactly the functional component. Zimnitsky test, carried out in drinking mode and concentration test. It is worth remembering that if the change in night density is permanent, you need to urgently consult a doctor who will help you deal with the problem and find its cause.
Specific gravity of other materials
It is difficult to imagine our world without many materials used in production and everyday life. For example, without iron and its compounds (steel alloys). The HC of these materials fluctuates in the range of one to two units and these are not the best results. Aluminum, for example, has low density and low specific gravity. These indicators allowed it to be used in the aviation and space industries.
Specific gravity of metals
Copper and its alloys have a specific gravity comparable to lead. But its compounds - brass and bronze are lighter than other materials, due to the fact that they use substances with a lower specific gravity.
Norms for adults and children
The total volume of fluid involved in metabolic processes is not a constant value. Factors such as:
- air temperature;
- drinking regime;
- current time of day;
- the presence of salty or spicy foods on the menu;
- the amount of fluid released by sweating and breathing.
However, normally in an adult, variations should fall within the range of 1.014-1.025 g/liter (normosthenuria).
During pregnancy, the range of daily values can be wider - 1.003-1.035. The reasons for this are partly toxicosis, nausea and vomiting, which causes dehydration.
If there is a deviation of the indicator (in the analysis form –), the following is distinguished:
- isosthenuria – SG fluctuations within limited limits – 1.010-1.012;
- hyposthenuria – decrease in SG less than 1.010 (1.008);
- hypersthenuria – increase in SG to 1.025 (1.030) and higher.
An increase in density can also be initiated by factors such as:
- presence of sugar in the blood – 1% per 0.004 g/liter;
- the presence of protein in urine - 3 g/liter of protein corresponds to an increase in SG by 0.001.
Normal specific gravity values for children can be summarized in the table:
| Child's age | Normal limits, g/liter |
| from 1 to 10 days | 1,008-1,018 |
| up to 6 months | 1,002-1,004 |
| up to 1 year | 1,006-1,016 |
| 2-3 years | 1,010-1,017 |
| 4-5 years | 1,012-1,020 |
| 7-8 years | 1,008-1,022 |
| 10-12 years | 1,010-1,025 |
In general, a specific gravity value of 1.020 g/liter is above the norm for children.