Copper is among the top most common elements and is in twenty-sixth place. Usually it is found in the natural environment in the form of separately located pure nuggets, but recently such finds are becoming less and less common. Accordingly, such deposits make up only a minimal share in metal production.
The bulk of copper is mined from rocks in which it is found, often in combination with other metals. There are a large number of copper minerals. But in the metallurgical industry the most valuable types are:
- copper pyrite;
- malachite;
- chalcopyrite;
- azurite
The Russian Federation is one of the five world leaders - countries in which copper mining accounts for the largest share and brings the most fruitful results. Often copper, which is not located too deep relative to the surface of the earth, is mined by opencast mining. For this purpose, huge quarries or cuts are dug. These open copper mining sites can be several kilometers wide. The depths of the quarries can extend for more than one hundred meters. In this way, about two-thirds of all copper produced is mined. But in cases where copper deposits are deep underground, special structures are built that are designed to extract the element under the layers of the earth. They are called mines. In Russia, copper is mined using both the first and second methods.
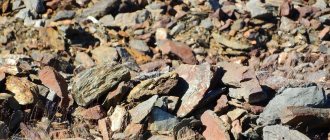
Copper deposits
Metals in the copper subgroup are characterized by low chemical activity, for this reason they are found in the form of chemical compounds, as well as nuggets. Many centuries ago, copper could only be found in the form of sulfur compounds - chalcopyrite and chalcocite. This is because copper has a high chemical affinity for sulfur. Most primary ores contain copper in sulfide form - CuS. Over time, especially under conditions of volcanic activity, under the influence of large amounts of oxygen, copper sulfides became oxides. Copper nuggets were formed in nature during the strong heating of oxidized sulfur ore. For example, if oxidized copper minerals and sulfur ores lay under a thick layer of rock, they were heated by natural disasters and earthly heat. In such natural “metallurgical shops” colossal volumes of copper were smelted. A nugget weighing 420 tons was found in North America. However, this is rare; native copper on the planet is approximately 1%.
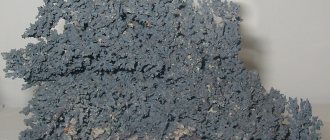
What ores do copper come from?
Copper is extremely rare in the form of nuggets. It is always mined with additional impurities. The largest nugget was found in the USA. It weighs more than 420 tons.
A total of 20 types are used in heavy industry. The most famous and widely used of them are chalcocite, chalcopyrite and bornite. What are their properties?
- Chalcocite is the most concentrated copper. Here its concentration can be up to 80%.
- Chalcopyrite is copper, which is part of polymetals and has hydrothermal origin.
- Bornite - this type has a bluish tint due to impurities of iron and silver. Concentration - more than 60%.
- Kovelin belongs to the hydrothermal group, like chalcopyrite. The concentration is 64%.
It is from these ores that most of the metal is obtained, which is then used by humans.
World copper deposits
A lot of copper, like other minerals, is located at the bottom of the oceans. At the bottom there are clusters of round stones containing approximately 0.5% copper. According to the analysis of geologists, the reserves of copper ore in the ocean reach 5 billion tons. There are almost 250 copper minerals, but only 20 are used industrially. The main copper ores include:
- chalcocite - Cu2S, which contains 79.8% copper
- chalcopyrite - CuFeS2, which contains 30% copper. This ore accounts for almost 50% of all copper deposits
- bornite - Cu5FeS4, contains from 52 to 65% copper
- covellite – CuS, contains 64% copper.
According to genetic and industrial-geological parameters, copper deposits are:
- stratiform, which include copper shales and sandstones
- pyrites. This group includes native and vein copper
- hydrothermal
- igneous, including the most common ores of the copper-nickel type
- carbonate. This group includes iron-copper and carbonatite ores.
Copper reserves in the world
The largest amount of copper, approximately 65%, occurs in North and South America. European states have 15% of resources, Asian states - 11%, African states - 4.5%. The largest confirmed copper reserves are recorded in Chile. Almost 20% of the world's reserves are located there. And in the USA - 12.7%. In addition to these countries, there is a lot of copper in Poland, Indonesia, Iran, Kazakhstan, China, Uzbekistan, the Philippines, as well as in Zaire, Zambia, Brazil, Canada, Mexico, Panama, Peru and Australia. In each of these states, according to experts, there are about 10 million tons.
promotion
Around the country
The following table shows all countries whose annual production in 2022 was more than 10,000 tons. The copper content in ores and concentrates is given. Copper has not been mined in Germany since the early 1990s. All figures refer to states within their current borders.
Figures in thousands of tons
| Rank (2018) | a country | 1970 | 1980 | 1990 | 2000 | 2010 | 2015 | 2016 | 2017 | 2018 |
| 1. | Chile Chile | 686 | 1,068 | 1,588 | 4 602 | 5 419 | 5772 | 5,553 | 5 504 | 5 832 |
| 2. | Peru Peru | 220 | 367 | 323 | 554 | 1,247 | 1,701 | 2354 | 2,446 | 2,437 |
| 3. | People's Republic of China People's Republic of China | 120 | 165 | 285 | 889 | 1,156 | 1,712 | 1 900 | 1,706 | 1,591 |
| 4th | USA USA | 1,560 | 1,181 | 1,588 | 1,444 | 1,110 | 1,416 | 1,462 | 1,290 | 1,250 |
| 5. | Democratic Republic of the Congo DR Congo | 386 | 462 | 352 | 33 | 378 | 1,039 | 1,024 | 1,095 | 1,225 |
| Sixth | Australia Australia | 158 | 244 | 330 | 832 | 871 | 996 | 948 | 849 | 913 |
| 7th | Zambia Zambia | 684 | 610 | 546 | 249 | 767 | 711 | 725 | 797 | 851 |
| 8th. | Russia, Russia | 387 | 400 | 643 | 530 | 703 | 711 | 702 | 762 | 785 |
| 9. | Mexico Mexico | 61 | 175 | 299 | 365 | 270 | 594 | 766 | 742 | 697 |
| 10. | Indonesia Indonesia | 59 | 162 | 1.012 | 863 | 579 | 728 | 622 | 651 | |
| 11. | Kazakhstan Kazakhstan | 138 | 143 | 230 | 430 | 381 | 474 | 475 | 558 | 636 |
| 12th | Canada Canada | 610 | 716 | 794 | 634 | 522 | 715 | 693 | 597 | 539 |
| 13th | Mongolia Mongolia | 44 year | 124 | 126 | 128 | 318 | 516 | 475 | 459 | |
| 14th | Poland Poland | 83 | 343 | 370 | 454 | 426 | 426 | 424 | 419 | 401 |
| 15th | Brazil Brazil | 4th | 34 | 32 | 214 | 359 | 338 | 385 | 381 | |
| 16. | Iran Iran | 1 | 67 | 147 | 257 | 246 | 289 | 296 | 317 | |
| 17th | Spain Spain | 10 | 49 | 13th | 25th | 54 | 113 | 168 | 198 | 185 |
| 18th | Myanmar Myanmar | 10 | 71 | 95 | 116 | 154 | ||||
| 19th | Laos Laos | 132 | 168 | 178 | 153 | 147 | ||||
| 20th | Bulgaria Bulgaria | 42 | 62 | 33 | 93 | 113 | 112 | 110 | 109 | 109 |
| 21st | Sweden Sweden | 26th | 43 years old | 74 | 78 | 77 | 75 | 79 | 104 | 106 |
| 22nd | Uzbekistan Uzbekistan | 42 | 43 years old | 69 | 70 | 80 | 100 | 100 | 100 | 100 |
| 23 | Papua New Guinea Papua New Guinea | 147 | 170 | 203 | 160 | 45 | 80 | 105 | 96 | |
| 24 | Armenia Armenia | 1 | 1 | 1 | 12th | 31 year | 84 | 103 | 114 | 84 |
| 25th | turkey turkey | 31 year | 21 years old | 40 | 76 | 80 | 108 | 100 | 83 | 80 |
| 26th | Philippines Philippines | 160 | 305 | 181 | 32 | 58 | 84 | 84 | 68 | 70 |
| 27 | Saudi Arabia Saudi Arabia | 2 | 12th | 28 | 36 | 68 | ||||
| 28. | Portugal Portugal | 4th | 4th | 160 | 76 | 74 | 83 | 74 | 64 | 49 |
| 29 | South Africa South Africa | 144 | 201 | 188 | 148 | 103 | 77 | 65 | 66 | 47 |
| 30's | Finland Finland | 31 year | 53 | 18th | 12th | 15th | 41 years old | 47 | 53 | 47 |
| 31. | Serbia Serbia | 85 | 107 | 129 | 46 | 23 | 30's | 41 years old | 45 | 44 year |
| 32. | India India | 10 | 27 | 52 | 38 | 32 | 32 | 32 | 34 | 37 |
| 33. | Mauritania Mauritania | 37 | 45 | 33 | 29 | 28 | ||||
| 34. | Morocco Morocco | 15th | 20th | 24 | 25th | 24 | ||||
| 35. | Vietnam Vietnam | 12th | 23 | 23 | 21 years old | 23 | ||||
| 36. | Argentina Argentina | 1 | 145 | 140 | 62 | 82 | 33 | 17th | ||
| 37. | Eritrea Eritrea | 62 | 25th | 8th | 17th | |||||
| 38. | Pakistan Pakistan | 20th | 16 | 14th | 15th | 17th | ||||
| 39. | Namibia Namibia | 23 | 39 | 28 | 5 | 14th | 17th | 16 | 15th | |
| 40. | Georgia Georgia | 3 | 3 | 4th | 9 | 11 | 13th | 14th | 15th | 13th |
| 41. | Colombia Colombia | 2 | 1 | 5 | 8th | 9 | 10 |
By company
The company, the country in which it is located, the volume of production and the share of world production are listed.
Figures in thousands of tons (2017)
| classify | Companies | a country | quantity | Ownership % |
| 1. | Codelco | Chile Chile | 1840 | 9.1 |
| 2. | Freeport-McMoRan | USA USA | 1436 | 7.1 |
| 3. | Glencore | Switzerland Switzerland | 1247 | 6.2 |
| 4th | Grupo Mexico | Mexico Mexico | 883 | 4.4 |
| 5. | BHP Billiton | Australia Australia United Kingdom United Kingdom | 796 | 3.9 |
| Sixth | KGHM Polska Mied | Poland Poland | 553 | 2,7 |
| 7th | The first quantum minerals | Canada Canada | 513 | 2,5 |
| 8th. | Rio Tinto Group | Australia Australia United Kingdom United Kingdom | 499 | 2,5 |
| 9. | Antofagasta plc | United Kingdom United Kingdom | 486 | 2.4 |
| 10. | Group of Minerals and Metals | Australia Australia | 445 | 2.2 |
Global funding
The following table shows global production in thousands of tons.
Figures in thousands of tons
| 495 | |
| 1901 | 526 |
| 1902 | 555 |
| 1903 | 596 |
| 1904 | 660 |
| 1905 | 713 |
| 1906 | 724 |
| 1907 | 721 |
| 1908 | 744 |
| 1909 | 828 |
| 1910 | 858 |
| 1911 | 890 |
| 1912 | 1,000 |
| 1913 | 996 |
| 1914 | 938 |
| 1,060 | |
| 1916 | 1,420 |
| 1917 | 1,430 |
| 1918 | 1,430 |
| 1919 | 994 |
| 1920 | 959 |
| 1921 | 558 |
| 1922 | 884 |
| 1923 | 1,270 |
| 1924 | 1,360 |
| 1925 | 1,530 |
| 1926 | 1,510 |
| 1927 | 1,520 |
| 1928 | 1,730 |
| 1929 | 1,950 |
| 1,610 | |
| 1931 | 1,400 |
| 1932 | 909 |
| 1933 | 1,050 |
| 1934 | 1,280 |
| 1935 | 1,500 |
| 1936 | 1,720 |
| 1937 | 2290 |
| 1938 | 1,990 |
| 1939 | 2,130 |
| 1940 | 2400 |
| 1941 | 2,480 |
| 1942 | 2,590 |
| 1943 | 2 620 |
| 1944 | 2,460 |
| 2,110 | |
| 1946 | 1,780 |
| 1947 | 2,130 |
| 1948 | 2,210 |
| 1949 | 2,140 |
| 1950 | 2380 |
| 1951 | 2,490 |
| 1952 | 2,570 |
| 1953 | 2600 |
| 1954 | 2640 |
| 1955 | 2 900 |
| 1956 | 3 200 |
| 1957 | 3 300 |
| 1958 | 3 190 |
| 1959 | 3 430 |
| 3 940 | |
| 1961 | 4 090 |
| 1962 | 4220 |
| 1963 | 4290 |
| 1964 | 4 450 |
| 1965 | 4 660 |
| 1966 | 4,580 |
| 1967 | 4 630 |
| 1968 | 5,010 |
| 1969 | 5 520 |
| 1970 | 5 900 |
| 1971 | 5 940 |
| 1972 | 6 540 |
| 1973 | 6 920 |
| 1974 | 7 100 |
| 6 740 | |
| 1976 | 7 260 |
| 1977 | 7 420 |
| 1978 | 7 280 |
| 1979 | 7,350 |
| 1980 | 7 200 |
| 1981 | 7 690 |
| 1982 | 7 580 |
| 1983 | 7 610 |
| 1984 | 7 810 |
| 1985 | 7 990 |
| 1986 | 7 940 |
| 1987 | 8 240 |
| 1988 | 8 720 |
| 1989 | 9 040 |
| 9 200 | |
| 1991 | 9 330 |
| 1992 | 9 470 |
| 1993 | 9 490 |
| 1994 | 9 500 |
| 1995 | 10 000 |
| 1996 | 11 000 |
| 1997 | 11 500 |
| 1998 | 12 100 |
| 1999 | 12 800 |
| 2000 | 13 200 |
| 2001 | 13 700 |
| 2002 | 13 600 |
| 2003 | 13 800 |
| 2004 | 14 700 |
| 2006 | 15 100 |
| 2007 | 15 500 |
| 2008 | 15 600 |
| 2009 | 16 000 |
| 2010 | 16 100 |
| 2011 | 16 300 |
| 2012 | 16 900 |
| 2013 | 18 300 |
| 2014 | 18 500 |
| 2015 | 19 100 |
| 2016 | 20 100 |
| 2017 | 20 000 |
| 2018 | 20 400 |
| 2019 e | 20 000 |
Copper ore mining
Due to the low copper content in the ore, its extraction involves processing large volumes of rock. In order to smelt 1 ton of copper, over 200 tons of ore must be processed. Copper mining methods:
- open method. If ore deposits are located close to the earth's surface, then they are developed in this way; the depth of open-pit mining is 150-300 m. The method is characterized by lower losses
- underground method. Using this method, ore is mined from a depth of 500 m, and sometimes from 800-1000 m.
There are five technological systems for field development:
- using self-propelled equipment. This technology is widely used
- using continuous vibration mechanisms
- using hardening goaf backfill. In this case, there is a continuous excavation of reserves of powerful deposits with minimal losses. With the use of such systems, losses are reduced by 3-4 times
- method of extracting ore in horizontal layers. When filling goafs (in underground mines) with hardening compounds, pipes lined with rubber or basalt are used, the service life of which is 50-100 times higher than that of steel
- cyclic-flow technology for the implementation of mining operations.
Table 1. Copper mining in the world
| A country | Ore mining (thousand tons per year) | Reserves (million tons) |
| Chile | 5,38 | 140 |
| USA | 1,16 | 35 |
| Peru | 1 | 30 |
| Indonesia | 0,8 | 35 |
| Australia | 0,85 | 24 |
| Russia | 0,84 | 20 |
| China | 0,62 | 26 |
| World | 14,49 | 467 |
Reserves
The USGS distinguishes the following two categories:
- A reserve base is that portion of an identified resource that meets specific minimum physical and chemical criteria for current extraction and production methods, including grade, quality, thickness and depth. Publication of data on the storage base was stopped by the USGS in 2009.
- Inventories are that portion of the supply base that can be economically produced or produced at a given time. This term does not necessarily mean that the exhaust systems are installed and operating. Reserves contain only substances suitable for use.
The reserves of the countries with the largest production are listed here.
Figures in thousands of tons (2018)
| classify | a country | promotion | Reserves | Share base (2009) |
| 1. | Chile Chile | 5 830 | 200 000 | 360 000 |
| 2. | Peru Peru | 2,440 | 87 000 | 120 000 |
| 3. | Australia Australia | 920 | 87 000 | 88 000 |
| 4th | Russia, Russia | 751 | 61 000 | 30 000 |
| 5. | Mexico Mexico | 751 | 53 000 | 50 000 |
| Sixth | USA USA | 1,220 | 51 000 | 70 000 |
| 7th | Indonesia Indonesia | 651 | 28 000 | 38 000 |
| 8th. | People's Republic of China People's Republic of China | 1,590 | 26 000 | 63 000 |
| 9. | Democratic Republic of the Congo DR Congo | 1,230 | 19 000 | k. A. |
| 10. | Zambia Zambia | 854 | 19 000 | 35 000 |
| Other countries | 3 540 | 220 000 | 110 000 | |
| World | 20 400 | 870 000 | 1,000,000 |
Copper production centers
Copper production centers are present in different regions of Russia. Kazakhstan boasts the richest ore deposits. There are also deposits in the Urals. According to the latest data, Russia ranks first in the world in copper ore mining. Copper plants are being built in close proximity to the mines. The raw material factor is the determining component, due to the low content of concentrates in the feedstock. There are 11 copper complexes in the Urals, producing 43% of the country’s copper. In addition to our own raw materials, production also uses those imported from Kazakhstan. There are also waste recycling plants. For example, sulfur dioxide gases, as a byproduct of copper mining, are used to create sulfuric acid, which is then used to make fertilizers.
Source
Deposits of the main minerals on the world map
Mineral reserves have a significant impact on the economies of countries possessing these minerals, since the products of the mining industry are used for many vital industries. The minerals map shows the distribution of major deposits around the world.
World mineral map
Description: The map displays the location of deposits of the following minerals around the world (as listed on the map in the lower left corner, in order of priority):
- Uranium
- Silver
- Oil
- Lead and zinc
- Iron
- Diamonds
- Bauxite
- Coal
- Copper
- Gold
Minerals have proven to be a major factor in the economies of the world and have been the driving force behind the colonization of many countries throughout history, as well as the cause of many military conflicts. Indigenous peoples have often been exploited throughout history (and even today in some countries) due to their proximity to important minerals such as diamonds. The indigenous population provided cheap labor for mining for the benefit of the conquerors.
The largest mineral exporting countries today
Australia is the continent with the world's largest uranium reserves. Canada is the largest exporter of uranium ore. Mexico is the largest exporter of silver in the world. Previously, diamonds were only discovered in the alluvial deposits of southern India, although today diamonds are also found in Africa, South Africa, Namibia, Botswana, Democratic Republic of Congo, Tanzania and Congo. The most common element on earth is iron. The five largest producers of iron ore are China, Brazil, Australia, Russia and India. These five countries account for about 70 percent of global iron ore production.
Canada, the USA and Western Australia are the main gold mining areas. The world's oceans also contain huge amounts of gold. Copper ore is found in Chile, Mexico, USA, Indonesia, Australia, Peru, Russia, Canada, China, Poland and Kazakhstan. Oil reserves are found in Canada, the USA, Russia, Mexico, Saudi Arabia, Iran, Iraq, the United Arab Emirates and Kuwait. As a scarce but vital source of energy, oil has been the cause of many international conflicts around the world. Bauxite reserves are found in Australia, Brazil, Guinea, Guyana, India, Jamaica, Russia, Suriname, the USA and Venezuela.
Source
review
In 2022, global copper production was 20.4 million tonnes (2017: 20.0 million tonnes). By far the largest producing country was Chile (5.8 million tons), followed by Peru (2.4 million tons), People's Republic of China (1.6 million tons), USA (1.2 million tons) and DR Congo . (1.2 million tons). The share of these five countries in world production was 60.3%. In Europe, mention should be made of Russia, Poland, Bulgaria, Portugal and Sweden.
Copper smelting and refining is only partially carried out in the respective producing countries. In particular, China now smelts and refines a significant portion of the world's copper production. The following table provides an overview of the four countries with the largest volumes of refined copper.
Figures in millions of tons
| classify | a country | Funding (2017) | Melting (2016) | Recycling (2016) | |
| 1. | People's Republic of China People's Republic of China | 1,7 | 5.5 | 8.0 | |
| 2. | Chile Chile | 5.5 | 1.5 | 2,7 | |
| 3. | Japan Japan | USA USA | 1.3 | 0,5 | 1.2 |
Suitable reserves were estimated by the United States Geological Survey (USGS) in January 2022 at 870 million tons worldwide. Chile accounts for 200 million tons, Australia 87 million tons, Peru also 87 million tons, Russia 61 million tons and Mexico 53 million tons. These five countries together accounted for 56.1 percent of the world's reserves. The range of static reserves is approximately 43 years.
Copper mines on the Keweenaw Peninsula of Lake Superior/USA were historically significant (the world's largest deposit of native copper; mining dates back to pre-Columbian times). In Germany, copper slate was mined in the Mansfeld area until 1990.
Copper: properties, extraction methods and applications
A shiny pink metal with high ductility – that’s what copper is. The mineral is characterized by high electrical and thermal conductivity, lends itself well to mechanical processing and forms many compounds with other metals, which are quite widely in demand in human economic activity. In addition, copper is highly resistant to corrosion.
Its density is 8890 kg/m3.
The melting point is 1083 0 C.
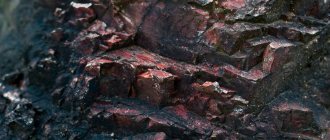
PROPERTIES
Native copper crystals, Lake Superior, Kinawee County, Michigan, USA. Size 12 x 8.5 cm
Copper is a golden-pink ductile metal; in air it quickly becomes covered with an oxide film, which gives it a characteristic intense yellowish-red hue. Thin films of copper have a greenish-blue color when exposed to light.
Along with osmium, cesium and gold, copper is one of the four metals that have a distinct coloration that is different from the gray or silver of other metals. This color tint is explained by the presence of electronic transitions between the filled third and half-empty fourth atomic orbitals: the energy difference between them corresponds to the wavelength of orange light. The same mechanism is responsible for the characteristic color of gold.
Copper has high thermal and electrical conductivity (it ranks second in electrical conductivity among metals after silver). Specific electrical conductivity at 20 °C: 55.5-58 MS/m. Copper has a relatively large temperature coefficient of resistance: 0.4%/°C and is weakly dependent on temperature over a wide temperature range. Copper is diamagnetic.
There are a number of copper alloys: brass - with zinc, bronze - with tin and other elements, cupronickel - with nickel and others.
Varieties of copper ores
There are nine geological types of copper ores of industrial importance:
- Iron-nickel ores occurring in igneous rocks.
- Cuprous sandstones and shales. Stratiform reserves account for 30% of copper reserves and therefore occupy second place in this list.
- Copper-nickel. The deposits are distinguished by a variety of shapes with large inclusions of the desired metal.
- Porphyry copper. They are the undisputed leader and provide 40% of global copper production.
- Carbonatite. They are unique in that there is only one deposit in the world; in addition, they contain alkaline compounds.
- Quartz-sulfide. They do not play a significant role in ensuring production.
- Native. They are located in oxidation areas of copper-sulfide ore mines.
- Skarn. They are located among limestones and are characterized by extreme heterogeneity of morphological structure.
Copper in the listed list of ores can be presented in sulfide, oxide or mixed form, which determines the corresponding types of deposits. Based on their structure in rocks, deposits are divided into disseminated, massive and continuous textures. In the near future, this list may be supplemented by ores lying at the bottom of seas and oceans, as well as nodules of uranium deposits.
Natural minerals containing copper
There are 250 copper-containing minerals in nature, but no more than 20 are used in practice. A list of the most common of them, indicating the percentage of copper:
- Native copper – 88-100%.
- Cuprite – 88.8%.
- Tenorit – 79.9%.
- Khalzokin – 79.8%.
- Covelline – 66.5%.
- Bornite – 52-65%
- Atakamit – 59.5%.
- Malachite – 57.4%.
- Brochantite – 56.2%.
- Azurite – 55.3%.
- Fahl ores – 22-53%.
- Enargit – 48.3%.
- Chrysocolla – 32.8-40.3%.
- Chalcopyrite – 34.5%.
- Cubanite – 22-24%.
Production and export
Smelting by country
All figures refer to states within their current borders.
Figures in thousands of tons
| Rank (2018) | a country | 1970 | 1980 | 1990 | 2000 | 2010 | 2016 | 2017 | 2018 |
| 1. | People's Republic of China People's Republic of China | 120 | 175 | 358 | 1.014 | 2 826 | 6,115 | 5 966 | 6 357 |
| 2. | Japan Japan | 603 | 929 | 1,041 | 1,331 | 1,356 | 1,290 | 1,192 | 1,263 |
| 3. | Chile Chile | 647 | 953 | 1,329 | 1,460 | 1,560 | 1,365 | 1,265 | 1,246 |
| 4th | Zambia Zambia | 683 | 601 | 355 | 180 | 535 | 698 | 788 | 829 |
| 5. | Russia, Russia | 368 | 516 | 954 | 550 | 647 | 665 | 730 | 754 |
| Sixth | USA USA | 1,489 | 1,008 | 1,158 | 862 | 601 | 563 | 470 | 536 |
| 7th | Korea, South South Korea | 5 | 64 | 161 | 371 | 476 | 510 | 510 | 530 |
| 8th. | India India | 9 | 28 | 41 years old | 256 | 654 | 773 | 823 | 492 |
| 9. | Poland Poland | 69 | 367 | 430 | 463 | 470 | 447 | 458 | 462 |
| 10. | Australia Australia | 112 | 175 | 192 | 391 | 410 | 445 | 360 | 378 |
| 11. | Peru Peru | 177 | 349 | 261 | 340 | 313 | 309 | 317 | 328 |
| 12th | Bulgaria Bulgaria | 40 | 59 | 30's | 163 | 247 | 245 | 323 | 317 |
| 13th | Germany Germany | 134 | 170 | 198 | 211 | 379 | 343 | 333 | 311 |
| 14th | Iran Iran | 79 | 156 | 188 | 153 | 114 | 304 | ||
| 15th | Kazakhstan Kazakhstan | 165 | 230 | 426 | 414 | 354 | 294 | 296 | 295 |
| 16. | Canada Canada | 465 | 493 | 476 | 544 | 318 | 304 | 289 | 290 |
| 17th | Mexico Mexico | 60 | 86 | 210 | 308 | 169 | 268 | 270 | 286 |
| 18th | Spain Spain | 55 | 103 | 121 | 290 | 259 | 292 | 272 | 285 |
| 19th | Indonesia Indonesia | 174 | 263 | 256 | 246 | 259 | |||
| 20th | Philippines Philippines | 153 | 150 | 216 | 215 | 240 | 171 | ||
| 21st | Sweden Sweden | 37 | 46 | 76 | 105 | 142 | 132 | 150 | 150 |
Oil refinery production
Around the country
All figures refer to states within their current borders.
Figures in thousands of tons
| Rank (2018) | a country | 1970 | 1980 | 1990 | 2000 | 2010 | 2016 | 2017 | 2018 |
| 1. | People's Republic of China People's Republic of China | 120 | 295 | 558 | 1,371 | 4,540 | 8 436 | 8 970 | 9 029 |
| 2. | Chile Chile | 452 | 811 | 1,192 | 2668 | 3 244 | 2 613 | 2,430 | 2,461 |
| 3. | Japan Japan | 713 | 1.014 | 1,008 | 1,437 | 1,549 | 1,553 | 1,488 | 1,595 |
| 4th | USA USA | 1444 | 1,730 | 2,017 | 1 802 | 1,095 | 1,220 | 1,080 | 1,070 |
| 5. | Russia, Russia | 346 | 502 | 722 | 842 | 900 | 860 | 949 | 1,039 |
| Sixth | Democratic Republic of the Congo DR Congo | 29 | 259 | 819 | 825 | 1,000 | |||
| 7th | Germany Germany | 440 | 425 | 532 | 709 | 704 | 671 | 694 | 672 |
| 8th. | Korea, South South Korea | 7th | 88 | 192 | 471 | 565 | 645 | 663 | 665 |
| 9. | Poland Poland | 93 | 357 | 346 | 486 | 547 | 536 | 522 | 502 |
| 10. | Zambia Zambia | 534 | 608 | 426 | 226 | 767 | 426 | 466 | 458 |
| 11. | India India | 10 | 23 | 46 | 260 | 512 | 788 | 831 | 450 |
| 12th | Kazakhstan Kazakhstan | 199 | 288 | 414 | 395 | 323 | 408 | 426 | 438 |
| 13th | Mexico Mexico | 53 | 97 | 157 | 343 | 247 | 462 | 446 | 437 |
| 14th | Spain Spain | 111 | 154 | 171 | 316 | 348 | 429 | 415 | 424 |
| 15th | Australia Australia | 127 | 182 | 274 | 509 | 424 | 475 | 386 | 408 |
| 16. | Belgium Belgium | 326 | 526 | 332 | 423 | 381 | 367 | 399 | 390 |
| 17th | Peru Peru | 33 | 224 | 182 | 452 | 394 | 331 | 335 | 337 |
| 18th | Canada Canada | 478 | 505 | 516 | 551 | 320 | 314 | 330 | 291 |
| 19th | Indonesia Indonesia | 158 | 279 | 253 | 271 | 275 | |||
| 20th | Iran Iran | 1 | 48 | 181 | 220 | 193 | 161 | 239 | |
| 21st | Sweden Sweden | 35 year | 56 | 97 | 133 | 190 | 207 | 219 | 224 |
By company
The list includes company, headquarters, refinery, and share of global production.
Figures in thousands of tons (2009)
| classify | Companies | a country | quantity | Ownership % |
| 1. | Codelco | Chile Chile | 1881 | 10,4 |
| 2. | Aurubis AG | Germany Germany | 1092 | 6.0 |
| 3. | Freeport-McMoRan | USA USA | 1028 | 5,7 |
| 4th | Jiangxi Copper | People's Republic of China People's Republic of China | 804 | 4.4 |
| 5. | Xstrata | Switzerland Switzerland | 761 | 4.2 |
| Sixth | Nippon Mining & Metals Company | Japan Japan | 666 | 3,7 |
| 7th | BHP Billiton | Australia Australia United Kingdom United Kingdom | 587 | 3.2 |
| 8th. | Sumitomo mining industry | Japan Japan | 529 | 2,9 |
| 9. | LS-Nikko Copper | Korea, South South Korea | 519 | 2,9 |
| 10. | Mitsubishi materials | Japan Japan | 506 | 2,8 |
| 11. | KGHM Polska Mied | Poland Poland | 503 | 2,8 |
Copper exports by country
The following table shows countries according to their copper exports. 2012 data in millions of dollars, as reported by the Observatory of Economic Complexity. The top ten countries are listed.
| # | a country | Cost in millions of US dollars |
| 1 | Chile Chile | 21 962 |
| 2 | Japan Japan | 4,542 |
| 3 | Kazakhstan Kazakhstan | 3 637 |
| 4th | Australia Australia | 2 904 |
| 5 | Poland Poland | 2 672 |
| Sixth | Russia, Russia | 2,528 |
| 7th | Zambia Zambia | 2 349 |
| 8th | India India | 2,248 |
| 9 | Germany Germany | 2,106 |
| 10 | Peru Peru | 1 989 |
Copper ore mining
Copper is one of the very first metals mastered by mankind. At the very beginning, it was mined by collecting nuggets, and then they learned to extract it from ores. Over the years, mining technologies have improved. But the determining factor when choosing a mining method has always been and is the depth of the deposits. However, there are specially developed standards that take into account many factors and allow you to choose the most successful solution from an economic point of view, in terms of choosing the working depth of development and the technologies used.
In career
If the seam of the mineral being developed is located at a depth of no more than 500 m, the most appropriate is the open-pit mining method. It is with its help that most copper ores are extracted. Despite a number of problems associated with the development of a large area, the movement of huge masses of waste rock, the use of a significant amount of technical equipment and the harmful impact on the environment, the method is characterized by fairly high efficiency and the absence of significant losses of minerals. The ratio of metal yield to mined ore is: 1:200.
After conducting preliminary geological studies at the site of the future quarry or open-pit mine, the upper layers of rock are removed and disposed of in dumps. Very often this is accompanied by drilling of solid rock masses and blasting operations. The fossil mineral is extracted in layers with the further development of new massifs. Ore is picked up by bucket equipment (excavators, loaders) and loaded onto vehicles (conveyors, dump trucks) for transportation to processing plants.
In the mines
If the desired ore is located at a depth of about 1 km, then a closed mining method is used, that is, the construction of a mine and the organization of vertical, inclined or horizontal workings. Using mining equipment and drilling equipment, copper-bearing layers are developed. After which the extracted rock is loaded and removed to the surface. For this purpose, underground structures are equipped with elevators, lifting equipment, and railway tracks.
The method is quite expensive, but at the same time it provides access to deep-seated deposits.
Drilling of the wells
There is a third method for extracting copper ores - by pumping leaching solutions of acids and alkalis deep into a pre-drilled well. The result is a semi-liquid mixture, extracted to the surface by powerful pumps and subjected to further processing.
Copper production
After mining the ore, the next problem arises: how to extract the necessary material from it? There are several ways.
One of the oldest technologies involved burning malachite ores with limited air access. The mass placed in pots, mixed with coal, burned, releasing carbon monoxide. Which led to achieving the desired result - obtaining copper that was sufficiently pure for its time.
It is clear that over the past centuries, methods and methods of ore processing have undergone major changes, driven by the goal of achieving the most optimal results for any type of primary raw material. That is why modern metallurgy is based on three main methods for producing copper.
Pyrometallurgical method
Based on high-temperature processes, the pyrometallurgical method is ideally suited for sulfide ores, which are sometimes quite poor in copper concentration. It allows you to extract metal even with a content of 0.5%.
But first of all, the feedstock is enriched during the flotation process. Its essence lies in thoroughly grinding the ore, filling it with water, and adding complex organic flotation reagents. They envelop mineral particles containing copper alloys, giving them non-wetting.
At the second stage of this process, foam is created in the solution, the bubbles of which pick up particles coated with organic matter. This happens under the influence of air flow, as a result of which the formations float to the surface, from where they are later taken up. The foam saturated with copper compounds is collected, squeezed out and dried.
After which the resulting concentrate is fired at a temperature of 1400 0 C. This is necessary to remove sulfur and oxidize sulfides. Then high-temperature (14,000 0 - 15,000 0 C) smelting is carried out in shaft furnaces to produce an alloy of iron and copper - matte. Next, in the process of Bessemer smelting in a converter under the influence of oxygen, the oxide is obtained, and then the blister copper itself, containing 90.95% of the metal. In this case, sulfur turns into an acid residue, and iron into silicate slag.
You can obtain pure copper from a rough substance using:
- fire refining,
- electrolysis,
- exothermic reduction reaction under the influence of hydrogen.
Hydrometallurgical method
To extract copper and a number of other metals from polymetallic ores containing less than 0.5% of the desired mineral, the hydrometallurgical method is used.
The extracted minerals are dissolved using non-concentrated sulfuric acid or ammonia. Copper is obtained from the resulting liquids during the displacement reaction. Metallic iron is used to carry out the reaction.
Electrolysis method
The method is designed to obtain pure copper through an electrolytic reaction.
Its technology is to produce pure copper thin sheet cathodes and thick plate anodes from blister copper. Placed then in a bath filled with copper sulfate, they react under the influence of electric current. Copper dissolves on the anodes and is deposited on the cathodes. Released impurities are removed by chemical methods.
Processing the resulting ore
As of today, there are 3 ways to process the resulting copper ore. Pyrometallurgical, hydrometallurgical and electrolysis.
The pyrometallurgical method is the most popular. The most common chalcopyrite is taken as the “working material”.
At the very beginning, enrichment is performed. For this purpose, the oxidative firing method is used. This method is very suitable for chalcopyrite, since it is primarily designed for ores with high sulfur concentrations. With this technology, the ore is heated to high temperatures (sometimes up to 8 thousand degrees Celsius), during which sulfur and oxygen interact, after which almost half of the sulfur evaporates. Next, the ore is heated even more in shaft or reverberatory furnaces. We are already talking about 1.4-1.5 thousand degrees.
Areas of use
There are many industries where this oldest of metals finds its application:
- Metallurgy. It is this industry that produces many finished products in the form
- rolled products: sheets, plates, strips, pipes, rods, tires, wire;
- alloys: bronze, brass, cupronickel, constantan, nickel silver manganin.
Both products and intermediate materials are widely used in technical industries, in the production of weapons, and in the arts and crafts. The distinctive features of the alloys are the preservation of mechanical properties, a high level of slip in a paired combination and anti-corrosion resistance.
- Mechanical engineering. A significant portion of copper-containing products obtained as a result of metallurgical processes is used here. These are high-strength alloys with aluminum, tin, silicon, and zinc. As well as various parts of machines and mechanisms. One of the directions is the production of hard solders, which again find application in the mechanical engineering industry.
- Chemistry. The catalyst for the polymerization of acetylene is again copper.
- Electrical engineering. Due to its high electrical conductivity, this metal has become indispensable as a conductor in the manufacture of buses, cables, wires, and printed circuit board tracks. They, in turn, are part of many electrical products, which also contain copper structural elements and alloys of this metal. In addition, copper is used in chemical current sources and in the manufacture of high-temperature superconducting materials.
- Energy. One of the important areas of using copper is the production of pipes based on it, which are an integral part of gas supply systems, water supply, heating, cooling, air conditioning and supply of process fluids.
- Jewelry making. The specifics of manufacturing precious items that serve as jewelry require a combination of a number of contradictory factors. To give strength to gold, copper is added to it. The pliability of the material does not decrease, but the service life and resistance to mechanical stress increase significantly.
Deposits in Russia and the world
On the territory of Russia there are many fairly large deposits of copper ore:
- Allarechenskoye, Monchegorskoye, Pechenga - Murmansk region.
- Gayskoye - Orenburg region.
- Mikheevskoye, Tominskoye – Chelyabinsk region
- Yubileiny, Sibayskoye, Podolskoye, Zapadno-Ozernoye, Uchalinskoye, Novo-Uchalinskoye, Oktyabrskoye - Republic of Bashkortostan.
- Bystrinskoye and Udokanskoye - Transbaikalia.
- Oktyabrskoye, Talnakhskoye - Krasnoyarsk Territory.
The following deposits of this mineral are highlighted on the world map:
- Chuquicamata, Escondida, Collahhuasi, Antamina, El Tesoro - Chile.
- Bingham Canyon, Keweenaw, Pebble - USA.
- Vale Salobu - Brazil.
- Nurkazgan - Kazakhstan.
- Uyu Tolgoi - Mongolia.
- Grazberg - Indonesia.